Your business intelligence architecture is the strategic blueprint for transforming raw data into actionable insights. It’s the integrated framework of technologies, processes, and governance that collects data from disparate systems, refines it, and delivers it to decision-makers in a format that drives tangible business outcomes.
Why a Strong BI Architecture Is Non-Negotiable
Think of your BI architecture as the central nervous system for your company’s data. Without a well-designed network, signals get lost, responses are slow, and critical information never reaches the right people. Similarly, a weak BI architecture leads to unreliable reports, conflicting metrics, and frustrated teams. It’s not just a technical inconvenience—it’s a direct inhibitor of growth.
A poorly designed system is a recipe for operational chaos. It leads to slow reports, conflicting numbers, and a whole lot of frustration. Ultimately, it results in poor business decisions based on flawed data. A strong architecture, on the other hand, is the engine that drives tangible results:
- Operational Efficiency: Automate data pipelines and reporting to eliminate manual effort and quickly identify process bottlenecks, freeing up teams to focus on strategy instead of data wrangling.
- Market Insights: Uncover customer behavior patterns and market trends ahead of your competitors, creating a significant competitive advantage.
- Enhanced Decision-Making: Establish a single source of truth that aligns the entire organization, enabling teams to act with speed and confidence.
The Foundation for Advanced Analytics
Getting your BI architecture right isn’t just about creating dashboards. It’s the critical first step for any serious work in advanced analytics, like artificial intelligence and machine learning. You can’t build a skyscraper on a shaky foundation, and you can’t train a predictive model on messy, disorganized data.
A well-structured BI architecture doesn’t just answer what happened; it provides the framework to understand why it happened and predict what will happen next. It turns data from a historical record into a strategic asset for future growth.
This is why companies are investing so heavily in modernizing their data systems. The global BI software market tells the story: it grew from USD 41.74 billion one year to USD 47.04 billion the next, and it’s on track to hit USD 168.06 billion by 2035. This explosive growth is driven by the shift from legacy on-premise systems to agile, cloud-based architectures. As detailed in this comprehensive market analysis, the future is integrated data warehouses, automated data pipelines, and AI-powered analytics. Building the right architecture is no longer just an IT project—it’s a core business imperative.
The Core Components of a Modern BI Architecture
To master business intelligence architecture, you must follow the data’s journey—from raw, fragmented sources to polished, actionable insights presented on a dashboard. Each component in this journey has a specific role in transforming raw information into a strategic asset.
Here’s a breakdown of the essential layers that make this transformation possible:
- Data Sources: The origin point. This includes everything from your CRM and ERP systems to SaaS platforms like Shopify and third-party APIs.
- Data Ingestion: The transport layer. ETL/ELT pipelines extract raw data from its source and load it into a central repository.
- Data Storage: The central repository. This is typically a cloud data warehouse (like Snowflake) or a data lakehouse, designed to handle vast volumes of structured and semi-structured data.
- Semantic Layer: The business translator. It converts complex data schemas into clear, standardized business terms (e.g., “customer lifetime value”) that everyone can understand and trust.
- Analytics Engines: The processing core. These are the powerful query engines that analyze massive datasets to answer business questions.
- Presentation Layer: The user interface. This is where data is visualized in interactive dashboards and reports using tools like Tableau or Power BI.
Data Sources and Ingestion
The journey begins with Data Sources, the operational systems capturing every transaction, interaction, and event. For a SaaS company, this could be user activity logs, subscription data from Stripe, and customer support tickets from Zendesk.
This is where ETL (or more commonly in modern stacks, ELT) tools come into play. They automate the extraction and loading of raw data into a data warehouse before any major transformations occur. This ELT approach is faster, more flexible, and preserves the raw data for future, unanticipated analysis.
Best practices for robust data ingestion include:
- Implement proactive monitoring: Set up automated alerts to instantly notify you of pipeline failures. Data gaps can corrupt analysis and erode trust.
- Use version control: Manage your pipeline configurations in Git to ensure reproducibility, track changes, and simplify debugging.
- Schedule intelligently: Run large data loads during off-peak hours to minimize impact on system performance.
The diagram below illustrates how these stages interconnect, systematically refining raw data into actionable intelligence.
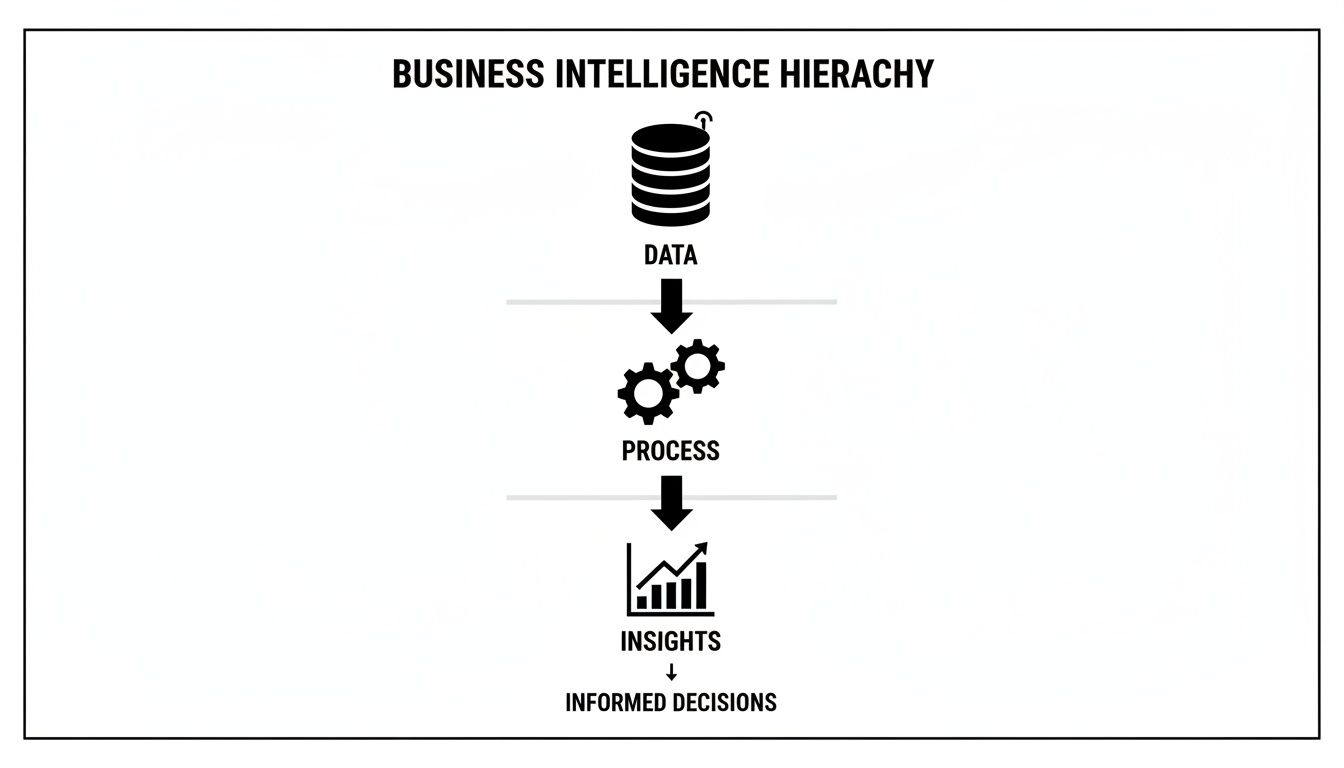
Each layer enriches the data, adding context and structure until it becomes a reliable foundation for decision-making.
Each stage refines data quality and context, driving faster, more confident decision-making.
Storage and Semantic Layer
Once ingested, data lands in a central storage layer engineered for both speed and scale. Cloud platforms like Snowflake or a Databricks lakehouse are dominant choices due to their ability to efficiently manage diverse data types and separate storage from compute costs.
Strategic storage design is critical for performance and cost-effectiveness:
- Leverage schema-on-read: This approach provides flexibility for handling semi-structured data sources without rigid upfront modeling.
- Partition and cluster tables: Partitioning tables by date or a key business unit dramatically accelerates query performance by reducing the amount of data scanned.
- Optimize for cost: Use native compression and clustering features to minimize storage costs without sacrificing performance.
The semantic layer sits atop the storage layer, acting as a crucial governance tool. It prevents ambiguity by standardizing business logic and metric definitions.
- Create a metrics catalog: Centrally define all key business metrics to eliminate conflicting calculations and ensure everyone speaks the same data language.
- Implement role-based views: Secure sensitive data by creating views that expose only the necessary information to specific user groups.
When people trust the data, they use it. It’s that simple.
Analytics Engines and Presentation
The analytics engine is the powerhouse that executes complex queries on your data. Modern cloud warehouses have highly optimized SQL engines and integrate seamlessly with transformation tools like dbt and machine learning frameworks.
Finally, the presentation layer is where value is delivered to the end-user. This is where curated data is transformed into compelling visual stories and interactive dashboards.
- Design for clarity: Choose the right visualization for the data. Line charts show trends over time, while bar charts excel at comparisons.
- Empower self-service: Build dashboards with interactive filters and drill-down capabilities, allowing users to explore data and answer their own questions without needing an analyst.
- Maintain brand consistency: Use consistent branding and design principles across all reports to build a professional, trustworthy analytics experience.
For example, a fintech company could use Power BI to visualize transaction data, allowing fraud analysts to drill down into suspicious patterns in real-time.
To get a better handle on the bigger picture, you can explore our guide on https://group107.com/blog/big-data-definition-importance-benefits/.
And if you want to see how these architectures unify customer data from all over the place, check out this excellent piece on Salesforce Data Cloud for customer insights.
Putting Components Together
Let’s make this real. Imagine an online store that wants to get smarter with its data.
Their Shopify store generates JSON logs for every sale and customer interaction. An ELT pipeline, maybe using Fivetran, pulls this raw data every hour and dumps it straight into Snowflake. From there, dbt runs transformation jobs, cleaning the data and modeling it into clean, usable tables for sales and customers.
Finally, Tableau connects to Snowflake and powers dashboards showing key metrics like conversion rate, average order value, and cost per acquisition.
Here’s the step-by-step:
- Extract sales and customer data from the Shopify API.
- Load raw event data into Snowflake using an ELT tool.
- Transform and model the data in dbt based on agreed-upon business logic.
- Query the modeled data using Snowflake’s compute layer.
- Serve the results to Tableau for visualization and self-service exploration.
- Act on the insights from the dashboards to optimize marketing and inventory.
When you understand how these core components fit together, you can design a BI architecture that not only meets your needs today but also scales with you tomorrow. Start mapping your own data journey to unlock better insights and make faster decisions.
Choosing Your BI Architecture Pattern
Selecting the right business intelligence architecture is a strategic decision that dictates your organization’s data capabilities. The right choice unlocks agility and innovation; the wrong one creates bottlenecks and stifles growth.
Think of it like designing a city’s transportation network. A small town may only need a centralized bus system. A growing city requires a flexible subway network. A global megacity demands a decentralized mesh of interconnected transit hubs to function efficiently. Each architectural pattern solves a different problem at a different scale.
Let’s break down the most common architectural models to help you evaluate the trade-offs between control, agility, and scalability.
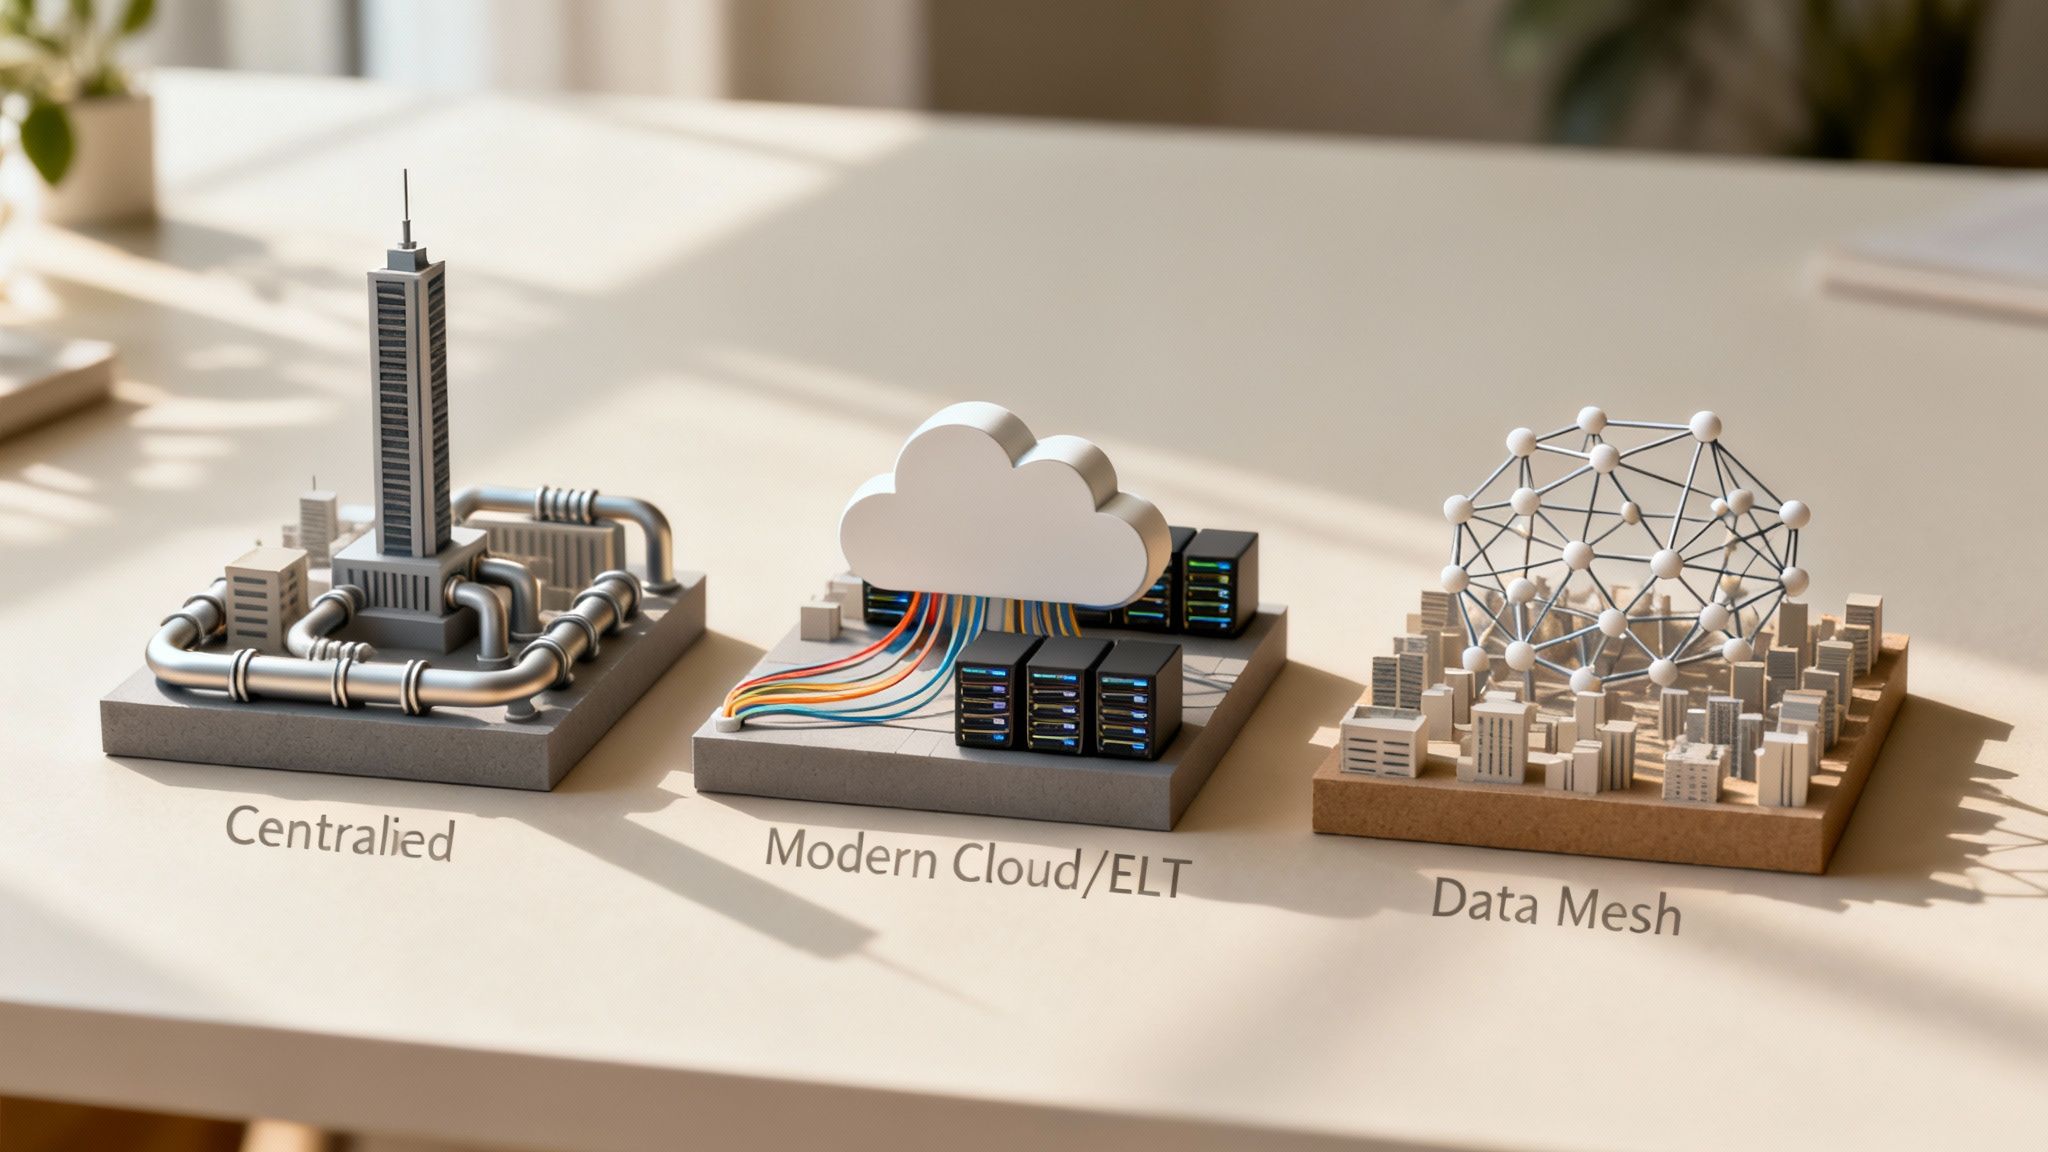
The Centralized Model: A Single Source of Truth
The traditional Centralized BI architecture is built around a single, enterprise-wide data warehouse managed by a central IT or data team. This top-down approach enforces strict governance and ensures a unified source of truth for all reporting, which is critical for consistency.
This model is often preferred in highly regulated industries like finance or government, where auditable, standardized reporting is non-negotiable for compliance.
However, this control comes at a cost. Business users must submit requests to the central team for new data or reports, creating significant delays that hinder self-service analytics and slow down decision-making.
- Best For: Organizations where data consistency and regulatory compliance are the highest priorities.
- Key Benefit: Strong governance and a single, trustworthy version of the truth.
- Main Drawback: Creates a bottleneck that slows down access to insights for business teams.
The Modern Cloud ELT Approach
The Modern Cloud/ELT architecture flips the traditional model on its head. Instead of transforming data before loading it (ETL), this approach leverages the immense power of cloud data warehouses like Snowflake or BigQuery to load raw data first and transform it later (ELT).
This delivers unparalleled flexibility and scalability. Data teams can integrate new sources in hours, not weeks, and analysts gain access to raw, unfiltered data for deeper exploration. This model aligns perfectly with agile workflows, enabling rapid iteration and accelerating time-to-insight. If this is a new concept, understanding what the cloud is and why you need it is an excellent first step.
This pattern truly democratizes data. By using the cloud’s elastic compute and storage, businesses can empower more people with self-service tools while still maintaining a governed, reliable core.
Consider a fast-growing SaaS company. With this model, the marketing team can connect a new advertising platform’s data, model it with a tool like dbt, and build new dashboards in Tableau—all without waiting for IT.
The Data Mesh: Empowering Domain Teams
For large, complex enterprises, even a modern cloud architecture can eventually become a monolithic bottleneck. The Data Mesh is a decentralized paradigm that treats data as a product. It shifts ownership of data pipelines and analytics directly to the business domains (e.g., marketing, finance, operations) that know the data best.
Each domain team is responsible for building, managing, and sharing its own “data products” in a standardized, discoverable way. A central platform team provides the underlying infrastructure and governance standards, but the domains drive the analytics.
- Empowers Autonomy: Product teams at a global e-commerce company can manage their own data without being blocked by a central team.
- Drives Scalability: It eliminates the central pipeline bottleneck that plagues many large organizations.
- Requires Maturity: This advanced model is not for beginners. It demands a strong data culture, significant investment in platform engineering, and robust governance standards.
This pattern is incredibly powerful for scaling analytics in large organizations, but it requires high data literacy and executive buy-in to succeed.
Comparison of Business Intelligence Architecture Patterns
Choosing the right pattern requires a careful evaluation of your organization’s governance needs, agility requirements, and scalability goals. The table below outlines the key differences to help you align your business needs with the optimal architecture.
| Pattern | Data Governance | Agility & Speed | Scalability | Best For |
|---|---|---|---|---|
| Centralized | High (Top-down control) | Low (Prone to IT bottlenecks) | Moderate (Limited by central team) | Regulated industries, small companies needing consistency |
| Modern Cloud/ELT | Balanced (Central governance, user flexibility) | High (Supports agile, self-service) | High (Leverages cloud elasticity) | Mid-size to enterprise SaaS, tech, and e-commerce |
| Data Mesh | Federated (Domain ownership, central standards) | Very High (Decentralized teams move fast) | Very High (Scales with the organization) | Large, complex enterprises with mature data cultures |
Ultimately, the best business intelligence architecture is the one that aligns with your operational reality. The centralized model gives you control, the modern cloud setup offers a balance of speed and governance, and the data mesh delivers autonomy at enterprise scale. Take a hard look at your business needs to select the blueprint that will turn your data into a genuine competitive advantage.
Designing a Future-Proof BI Architecture
Building a resilient business intelligence architecture is about more than selecting the latest tools. It requires a design philosophy centered on scalability, security, and cost-effectiveness. These principles are the strategic pillars that ensure your data platform remains a valuable asset for years to come, adapting to new challenges and opportunities.
Planning for Scalability and Performance
Your data volume and user base will grow—this is a certainty. A scalable architecture is designed to handle this growth gracefully without requiring a costly and disruptive overhaul. Performance is the other side of this coin; the system must deliver insights at the speed of business, even under increasing load.
- Design for Data Growth: Choose cloud-native platforms like Snowflake, Google BigQuery, or Amazon Redshift. These architectures allow you to scale compute and storage resources independently, optimizing costs.
- Support User Concurrency: As more users access the platform, performance can degrade. Implement query caching, materialized views for common reports, and workload management to ensure a smooth user experience for everyone, from analysts to executives.
- Optimize Query Performance: A slow dashboard is an unused dashboard. Employ data warehousing best practices like table partitioning (by date or region) and clustering to ensure queries on large datasets execute rapidly.
Implementing Robust Governance and Security
Data governance and security are the foundations of trust. Without them, you risk inconsistent metrics, data breaches, and non-compliance with regulations like GDPR or CCPA. A future-proof architecture embeds these principles from day one.
A scalable BI system without proper governance is a recipe for chaos. It creates an environment ripe for conflicting KPIs, accidental data leaks, and serious regulatory violations.
Effective governance ensures everyone is speaking the same data language.
- Enforce Role-Based Access Control (RBAC): Not everyone should see everything. RBAC is non-negotiable for restricting access to sensitive data, such as financial records or PII, based on an employee’s role.
- Track Data Lineage: You must be able to answer, “Where did this number come from?” Data lineage tools trace data from its source through every transformation, which is critical for debugging, auditing, and building trust in your reports.
- Establish a Data Catalog: A data catalog acts as a searchable library for your data assets. It helps users discover relevant datasets, understand business definitions, and identify official data sources, preventing the creation of redundant or conflicting reports.
Managing Costs and Maximizing ROI
Cloud BI offers incredible power, but costs can spiral out of control if not managed proactively. Inefficient queries, idle compute clusters, and unmonitored usage will quickly erode your budget. A future-proof architecture incorporates cost optimization from the start. Integrating advanced tech like Artificial Intelligence (AI) can significantly enhance this by enabling predictive cost modeling and automated resource optimization.
To maximize ROI, you must actively monitor and optimize your cloud resources. For any company looking to build a powerful and cost-effective system, knowing how to use AI in business is a major strategic advantage.
- Monitor and Audit Usage: Use your cloud platform’s native monitoring tools to track query costs and resource consumption. Identify and optimize the most expensive queries and dashboards.
- Automate Resource Management: Schedule intensive data processing jobs during off-peak hours when compute costs are lower. Implement auto-scaling policies to shut down or scale down idle resources automatically.
- Implement Lifecycle Policies: Not all data requires immediate access. Create automated policies to move older, less frequently accessed data to cheaper “cold” storage tiers, significantly reducing storage costs without deleting valuable historical data.
A Step-By-Step Guide to Implementation
Moving from architectural diagrams to a fully operational business intelligence architecture requires a disciplined, phased approach. A well-defined implementation roadmap de-risks the project, ensures alignment with business objectives, and accelerates time-to-value.
This journey can be broken down into four distinct phases, guiding your team from initial discovery to a high-performing, reliable analytics platform.

Phase 1: Discovery and Assessment
Before writing any code, you must deeply understand your current state and future needs. This phase is about asking the right questions to define the scope and goals of your BI initiative.
Begin by auditing all existing data sources—CRMs, ERPs, marketing platforms, and third-party APIs. Simultaneously, conduct stakeholder interviews with business leaders in finance, marketing, sales, and operations to identify their most pressing analytical challenges and decision-making gaps.
The goal here isn’t just to list data systems; it’s to connect business objectives directly to data requirements. For example, if the goal is to “reduce customer churn by 10%,” you must identify exactly which data sources are needed to build a predictive churn model.
Phase 2: Technology Selection
With a clear understanding of your requirements, you can select the right tools for each layer of the architecture. The best technology is the one that solves your specific problems effectively, not just the one with the most hype.
The industry’s shift to the cloud is a critical factor here. Cloud platforms now hold 66% of the market share because they offer elasticity and scalability that legacy systems cannot match. The BI market is projected to grow from USD 38.15 billion to USD 56.28 billion by 2030, overwhelmingly driven by cloud-first strategies. You can learn more about the growth of cloud-based BI on Mordor Intelligence.
Your technology stack must address every architectural layer:
- Ingestion: Will you use a managed ELT service like Fivetran for speed and simplicity, or a more customizable orchestration tool like Airflow for complex workflows?
- Storage: Does a cloud data warehouse like Snowflake or BigQuery fit your structured analytics needs, or do you require a lakehouse like Databricks for mixed AI and BI workloads?
- Transformation: Will you empower analysts with a SQL-based tool like dbt for in-warehouse modeling, or use a visual ETL tool?
- Presentation: Which BI platform—Tableau, Power BI, or Looker—best aligns with your users’ skills and existing tech ecosystem?
Phase 3: Migration Planning and Execution
Migrating to a modern BI architecture requires a strategic, phased plan. A “big bang” cutover is extremely risky and prone to failure. The optimal approach is to identify a high-impact, low-complexity use case to tackle first. This initial success builds momentum and demonstrates the project’s value early.
Migration Checklist:
- Define a Pilot Project: Select a specific business area, like marketing attribution analysis, for the initial migration.
- Establish a Data Validation Framework: Implement automated tests to compare data between the legacy and new systems, ensuring accuracy and consistency.
- Run Systems in Parallel: For a limited period, operate both architectures simultaneously. This allows users to validate the new system while maintaining a reliable fallback.
- Conduct User Training: Train business users on the new BI tools and dashboards, focusing on self-service capabilities to drive adoption.
- Decommission Legacy Components: Once the new system is fully validated and adopted, formally decommission the old reports and pipelines.
Phase 4: Operationalizing with DevOps and AI
A modern BI architecture is not a static project; it’s a dynamic system that requires continuous improvement. Integrating DevOps principles—often called DataOps in the analytics world—is essential for maintaining reliability and agility.
Use tools like Git for version control of your transformation logic (e.g., dbt models) and infrastructure-as-code (IaC) to manage cloud resources. This enables automated CI/CD pipelines for safe and predictable deployments.
This robust foundation unlocks advanced capabilities. With clean, centralized data, you can seamlessly integrate AI and machine learning models to move beyond historical reporting into predictive analytics. For our clients in finance and government, we embed robust security and accessibility protocols into this framework from the ground up, ensuring your architecture is not just powerful but also compliant and secure by design.
Frequently Asked Questions About BI Architecture
Embarking on a new BI initiative naturally raises many questions. Getting clear, practical answers is the critical first step before committing to a design or modernization effort. Here are the most common questions we address for our clients in SaaS, finance, and enterprise tech.
What Is The Difference Between A Data Warehouse, Data Lake, And Data Lakehouse?
Understanding these foundational storage concepts is crucial, as they define where and how your data lives. Each was designed for a specific purpose, though the lines between them are blurring.
- Data Warehouse: Think of this as a highly organized library for business data. It stores structured data that has been cleaned, transformed, and modeled for specific analytical purposes. This makes it extremely fast and reliable for the standard reporting and dashboards that executives depend on.
- Data Lake: This is a vast, raw data repository. It can store enormous volumes of data in its native format—structured, semi-structured, and unstructured. It is ideal for data scientists performing exploratory analysis but is often too slow and complex for day-to-day business intelligence.
- Data Lakehouse: This modern architecture combines the best of both worlds. A data lakehouse offers the low-cost, flexible storage of a data lake with the performance, structure, and governance features of a data warehouse. It provides a single, unified platform for both traditional BI and advanced AI/ML workloads.
Should I Use ETL Or ELT For My Data Ingestion?
For nearly all modern, cloud-based BI architectures, the answer is ELT (Extract, Load, Transform). This approach offers superior flexibility and scalability compared to the traditional ETL method.
Traditional ETL (Extract, Transform, Load) required transforming data before loading it into the data warehouse. This created a bottleneck because legacy on-premise systems lacked the processing power and flexible schemas to handle raw data.
ELT leverages the massive power of modern cloud platforms like Snowflake or BigQuery. You load raw data directly into the warehouse first and then perform transformations using powerful, SQL-based tools like dbt. This process is faster, more adaptable, and preserves the raw data for future AI and machine learning initiatives.
The ELT pattern is the scalable, future-proof standard for today’s BI architecture. It decouples ingestion from transformation, allowing data teams to move faster and adapt to new business requirements without rebuilding entire pipelines.
How Does BI Architecture Support AI And Machine Learning?
A modern BI architecture is the essential launchpad for any meaningful AI and machine learning initiatives. You cannot build reliable predictive models on a foundation of siloed, inconsistent data.
A well-designed architecture enables AI/ML success by:
- Unifying Data: A cloud data warehouse or lakehouse acts as a single source of truth, combining the structured data needed for BI with the raw, granular data required to train ML models.
- Providing Scalable Compute: It offers on-demand access to the immense computing power needed for model training and inference without large upfront hardware investments.
- Enabling MLOps: The architecture integrates with MLOps frameworks to automate the deployment, monitoring, and retraining of models, ensuring they remain accurate and relevant over time.
This integrated setup allows you to embed predictive insights—such as customer churn risk or lead qualification scores—directly into the BI dashboards your business teams use every day, bridging the gap between historical analysis and future prediction.
What Are The First Steps To Modernize A Legacy BI System?
Modernizing a legacy BI system can feel overwhelming. The key is a phased, strategic approach that delivers quick wins to build momentum and prove value.
Here is a practical, four-step plan to begin your modernization journey:
- Audit and Define: Conduct a thorough audit of your current system. Identify all data sources, map data flows, and interview business users to understand their primary pain points and analytical needs.
- Build the Business Case: Instead of trying to fix everything at once, select a single, high-impact business problem where a modern system will deliver immediate, measurable value, such as optimizing marketing spend or improving supply chain forecasting.
- Create a Phased Migration Plan: Use that first project as your pilot. Select your modern cloud platform (e.g., Snowflake) and ELT tool (e.g., Fivetran) and migrate only the data necessary for that specific goal.
- Validate and Iterate: For a short period, run the new and old systems in parallel. This allows you to validate data accuracy, train users on the new tools, and demonstrate the value of the modern architecture before decommissioning legacy components.
Ready to design, build, or modernize a business intelligence architecture that drives real growth? Group 107 provides the expert data engineering and strategy teams you need to turn your data into a competitive advantage. https://group107.com