
Database performance tuning is far more than a technical checklist; it's the strategic practice of ensuring your database operates at peak efficiency, delivering query results with speed and reliability. This isn't just an IT concern—it's a core business function that directly impacts user experience, application responsiveness, and your bottom line.
Why Database Performance Is a Business Imperative
Slow applications damage businesses. A sluggish database leads to slow-loading e-commerce pages, unresponsive dashboards, or failed transactions at critical moments. Each instance of poor performance erodes customer trust and drives away revenue.
The data is clear: a mere 100-millisecond delay in page load time can cause a significant dip in conversion rates. For a user in a high-stakes financial application, a transaction timeout isn't just an inconvenience; it's a critical failure with immediate business impact. This is where database performance tuning transforms from a reactive chore into a strategic, proactive investment.
Shifting From Reactive Firefighting to Proactive Optimization
Historically, many teams waited for a crisis to act. A server crashes, users complain on social media, or the application grinds to a halt during a traffic spike. This reactive, fire-fighting cycle is stressful, costly, and detrimental to your brand.
A proactive approach flips the script. It focuses on continuous optimization to protect performance before it affects a customer. This involves establishing a structured rhythm of diagnosis, optimization, and monitoring.
This workflow isn't a one-off project; it's a continuous improvement loop.
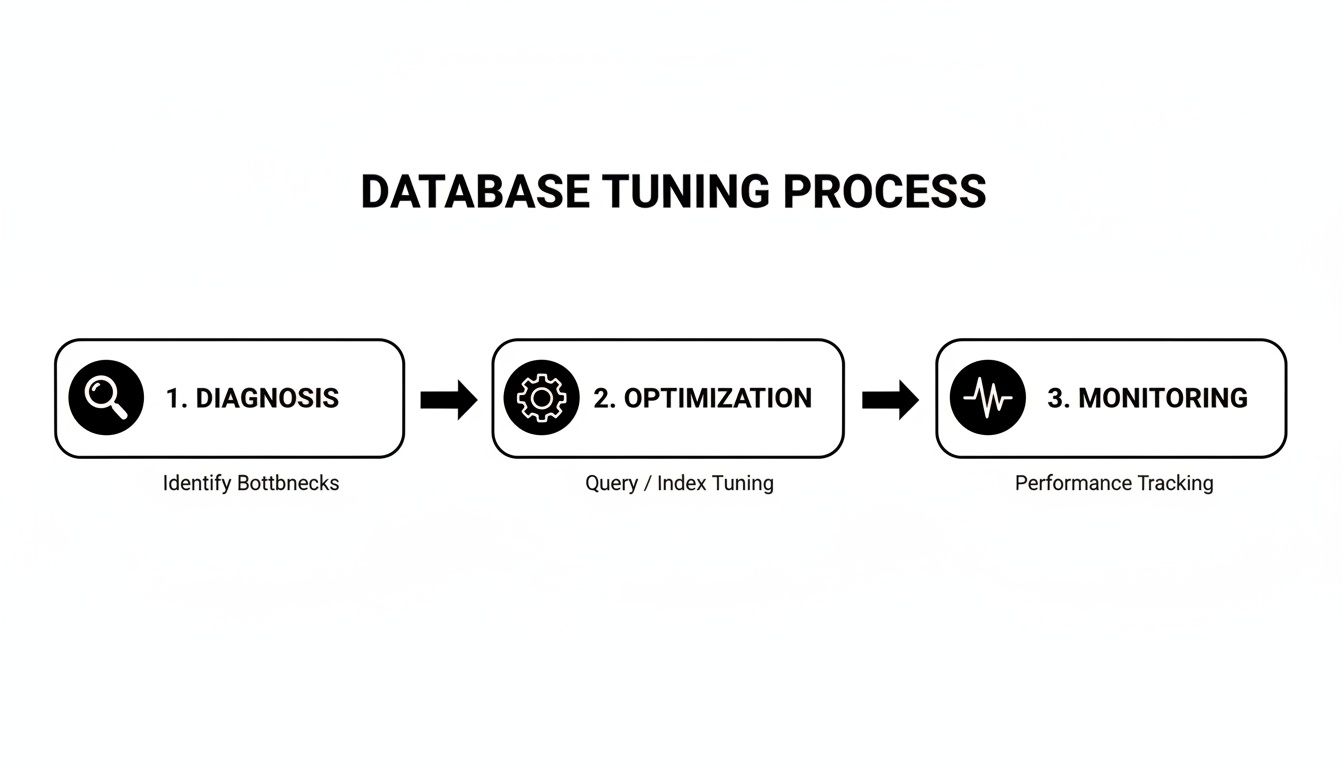
As the diagram illustrates, it’s a self-reinforcing cycle. You diagnose issues, apply optimizations, and monitor the results, which informs the next round of diagnosis.
By adopting this mindset, you turn a technical requirement into a competitive advantage. You build systems that are not only fast but also resilient and scalable. This proactive philosophy is a cornerstone of modern data engineering best practices and is essential for creating a data infrastructure that supports business growth.
The Four Pillars of Database Performance Tuning
To structure a comprehensive performance tuning strategy, we can break it down into four key areas. These pillars support a healthy, high-performing database environment.
| Pillar | Objective | Key Activities |
|---|---|---|
| 1. Diagnosis & Analysis | Identify the root cause of performance bottlenecks. | Profiling slow queries, analyzing execution plans, checking wait statistics, and reviewing system metrics (CPU, I/O, memory). |
| 2. Query & Index Optimization | Improve the efficiency of data retrieval operations. | Rewriting inefficient SQL, creating, modifying, or removing indexes, and updating stale statistics. |
| 3. Configuration & Hardware Tuning | Ensure the database and server are configured for the workload. | Adjusting memory allocation, connection pool settings, and storage configurations. Scaling hardware resources (vertical/horizontal). |
| 4. Monitoring & Alerting | Maintain long-term health and prevent future issues. | Setting up performance baselines, creating alerts for key metric deviations, and implementing continuous monitoring dashboards. |
This framework provides a high-level view of the entire process, from identifying a problem to ensuring it doesn't return. Each pillar is critical for building a robust and scalable system.
The goal is to treat database performance as a feature, not an afterthought. A well-tuned database directly supports key business objectives by improving customer retention, boosting conversions, and lowering the total cost of ownership for your infrastructure. It's a direct investment in your product's quality and your company's growth.
Pinpointing Bottlenecks with Performance Metrics
You cannot fix what you cannot measure. Effective database tuning begins with a clear, data-driven diagnosis—not guesswork. The process involves using hard metrics to identify the exact queries, configurations, or operations that are degrading application performance.
The primary diagnostic tool is the database's native execution plan. For most SQL databases, this can be generated with an EXPLAIN or EXPLAIN ANALYZE command. Think of it as a roadmap detailing how the database intends to fetch data for a query. It's here that the most glaring inefficiencies are revealed.

Decoding the Execution Plan
When analyzing an execution plan, you are hunting for red flags. These are classic performance killers that appear across all industries, from high-traffic e-commerce sites to complex enterprise financial systems.
Look for these common culprits:
- Full Table Scans: This indicates the database is reading every row in a table to find the required data, usually due to a missing index. On a table with millions of records, this is catastrophic for performance.
- Inefficient Joins: The plan may reveal a suboptimal join strategy, such as a Nested Loop Join on two large tables without proper indexes. This forces a massive number of unnecessary, time-consuming operations.
- High-Cost Operations: Each step in an execution plan has an assigned "cost." The operations with the highest cost are your prime suspects, as they consume the most resources.
Identifying these issues moves you from a vague complaint like "the user dashboard is slow" to a precise diagnosis: "The main widget's query is performing a full table scan on the transactions table." Now you have an actionable problem to solve.
Core Performance Metrics That Matter
Beyond individual queries, you need a holistic view of your database's health. This requires tracking key performance indicators (KPIs) that provide a system-wide perspective.
The most impactful improvements come from understanding the story your metrics are telling. A high latency for a single query might be an isolated issue, but consistently high latency across the board points to a systemic problem like I/O contention or insufficient memory.
Query optimization is foundational. As Percona's comprehensive guide highlights, techniques like query rewriting and smart indexing can dramatically slash execution times. These optimizations directly improve critical metrics such as query latency (milliseconds), throughput (transactions per second), and cache hit ratio (the percentage of data served from fast memory versus slow disk).
Connecting Metrics to Business Outcomes
The true power of technical metrics lies in translating them into tangible business impact. This context is crucial for securing stakeholder buy-in and prioritizing work.
Here’s how to frame the conversation:
- High Query Latency: This isn't just a number; it's a slow-loading dashboard or a frustratingly laggy search results page that causes user churn.
- Low Throughput: This means your system fails under pressure. For a fintech app, it could mean failed transactions during peak trading hours, leading to direct financial losses.
- Poor Cache Hit Ratio: This indicates your database is constantly accessing slow disk storage instead of fast memory, driving up infrastructure costs and slowing down the entire application.
When you connect technical data to a business narrative, you build a powerful case for investing in db performance tuning. This diagnostic phase provides the evidence needed to focus engineering efforts where they will deliver real, measurable improvements to user experience and the bottom line. Our DevOps as a Service offerings are designed to help teams engineer and maintain these exact kinds of high-performance systems.
Practical Query and Index Optimization Techniques
Once you've analyzed execution plans and pinpointed bottlenecks, it's time to move from diagnosis to action. A few surgical changes to your queries and indexes can yield the most dramatic performance improvements. Effective db performance tuning is about applying proven techniques to fix inefficient code and support it with smart data structures.
The objective is to reduce the database's workload. This means minimizing I/O, avoiding resource-intensive calculations, and making it as easy as possible for the database to find what it needs quickly.
Rewriting Queries for Maximum Efficiency
A poorly written query can bring an entire application to its knees. A common offender is the non-SARGable WHERE clause. SARGable (Searchable Argument) means a query is written so the database can use an index to find data efficiently.
When a WHERE clause is non-SARGable, it forces a full table scan, rendering your indexes useless.
Example: A Non-SARGable E-commerce Query
Imagine an e-commerce platform retrieving all orders from the last 30 days. A developer might write:
SELECT * FROM orders WHERE DATEDIFF(day, order_date, GETDATE()) < 30;
This logic is sound, but it's a performance disaster. The database must execute the DATEDIFF function on every row in the orders table before it can filter. An index on order_date is completely ignored.
The Optimized SARGable Version:
A simple rewrite transforms the query into a high-performer:
SELECT * FROM orders WHERE order_date >= DATEADD(day, -30, GETDATE());
Now, the database can use an index on order_date to jump directly to the relevant data, reading only the necessary rows. On a table with millions of orders, this change can reduce query execution time from minutes to milliseconds.
The Power of Strategic Indexing
Indexes are the unsung heroes of database performance. They act as specialized lookup tables that help the database engine find data instantly. However, more is not always better; you need the right indexes for your specific workload.
Here’s a quick guide to common index types and their use cases:
- B-Tree Indexes: The default index type for most databases, ideal for a wide range of queries involving equality (
=), ranges (>,<,BETWEEN), and sorting (ORDER BY). - Hash Indexes: Purpose-built for exact equality lookups (
=). They are extremely fast for this specific task but cannot handle range queries. Often used in memory-optimized tables. - GIN (Generalized Inverted Index): A PostgreSQL powerhouse designed for composite values, allowing you to search for elements within a value, such as words in a full-text search or items in a JSONB array.
Choosing the right index requires analyzing your query patterns. If your application frequently filters by a status and sorts by a date, a composite index on (status, date) will likely deliver the best results.
Every index you add is a trade-off. It accelerates
SELECTqueries but adds overhead toINSERT,UPDATE, andDELETEoperations, as the index must also be updated. The goal is to find the sweet spot—supporting your most critical read queries without degrading write performance.
Eliminating Dead and Fragmented Indexes
Index creation is only half the battle; maintenance is just as crucial. As your application evolves, some indexes may become unused or "dead," slowing down write operations and consuming disk space for no benefit. Regularly identifying and dropping these unused indexes is an easy performance win.
Furthermore, as data is constantly added and removed, indexes can become fragmented. This means their logical order no longer matches their physical order on disk, forcing extra I/O operations. Periodically rebuilding or reorganizing critical indexes on high-traffic tables can restore them to peak performance. These data hygiene practices are central to effective data engineering, ensuring your entire infrastructure runs smoothly.
When dealing with large result sets, be smart about data retrieval. Instead of fetching everything at once, which can overwhelm the database and application, implement techniques for flawless data pagination.
Tuning Your Database Configuration for Peak Performance
Running a database on default settings is like driving a performance car in first gear—you're leaving significant power untapped. After streamlining queries and indexes, the next major performance gain comes from tuning the server configuration itself. This step unlocks your hardware's potential and aligns its resources with your application's specific demands.
Many teams skip this step, assuming defaults are sufficient. This is a costly oversight. A well-configured database ensures frequently accessed data is served from fast RAM instead of slow disk, drastically reducing I/O and speeding up response times.
Demystifying Key Memory Parameters
The single most important configuration to adjust is memory allocation. The objective is simple: maximize your cache hit ratio. This is the percentage of data requests fulfilled directly from memory without disk access. A high ratio means fewer trips to storage, resulting in significantly faster performance.
Different database systems use different terminology, but the concept is the same.
- PostgreSQL: The key parameter is
shared_buffers. This reserves a specific amount of memory for caching data blocks. A common starting point is 25% of your system's RAM. - MySQL (InnoDB): The equivalent is
innodb_buffer_pool_size. On servers dedicated to the database, it's often set to 70-80% of available RAM.
These are just starting points. The optimal value depends on your workload. An application with a small, frequently accessed dataset may not need a massive buffer, while an analytics platform processing large datasets will benefit from as much memory as possible.
Maximizing Caching and Minimizing I/O
Smart memory configuration is one of the most powerful performance levers. Proper tuning can often slash physical I/O operations by 30-50%. Fine-tuning parameters like work_mem for sorting or temp_buffers for temporary tables ensures memory is used efficiently. A larger buffer cache allows the database to keep more data in RAM, which directly reduces disk reads and lowers overall IOPS. For a deeper look at these advanced settings, you can find resources that cover SQL performance tuning in detail.
I once worked with a fintech platform struggling with end-of-day reporting. Their queries were solid, but
innodb_buffer_pool_sizewas left at the 128MB default on a server with 64GB of RAM. We increased it to 48GB, allowing the entire reporting dataset to fit into memory. The result? Report generation time plummeted from over an hour to under five minutes.
The Non-Negotiable Role of Connection Pooling
For applications with high concurrency—such as SaaS platforms, e-commerce sites, or trading systems—connection pooling is essential. Opening and closing a new database connection for every request is incredibly resource-intensive, consuming CPU and memory on both the application and database servers.
During a traffic spike, this overhead can quickly overwhelm your system and cause a complete shutdown.
A connection pool maintains a set of open, ready-to-use database connections. When your application needs to run a query, it borrows a connection from the pool and returns it when finished. This is thousands of times faster than creating a new connection from scratch every time.
Key Connection Pool Parameters to Tune:
max_connections(Database): This server-side setting limits the total number of connections the database will accept. Setting it too high can lead to memory exhaustion.- Pool Size (Application): Your application's connection pool should be sized to handle peak traffic without exceeding the database's
max_connectionslimit.
By carefully tuning your database configuration and implementing connection pooling, you build a resilient, high-performance foundation. This ensures your optimized queries have the resources they need to execute quickly, delivering a fast and reliable user experience. As part of our DevOps solutions, we specialize in this kind of infrastructure optimization, building systems designed for scale and reliability from the start.
Using AI for Smarter Database Optimization
Manual database tuning is a complex and time-consuming process that requires years of specialized expertise. Even then, it is often a reactive effort to fix existing problems. A new, AI-powered approach is transforming this landscape, offering a practical solution for engineering and DevOps teams to achieve superior performance with less manual effort.
AI-powered platforms can analyze massive volumes of real-time performance data—far more than any human can process. They use machine learning models to identify subtle patterns and correlations, then recommend or automatically apply optimal configurations that a human might overlook. This marks a complete shift from reactive problem-solving to proactive, automated optimization.

How AI-Driven Tuning Platforms Work
Tools like OtterTune and DBtune are at the forefront of this movement, changing how we manage databases. The concept is to delegate the repetitive, complex task of configuration tuning to a machine learning model that continuously improves.
The workflow is straightforward:
- Data Collection: An agent securely monitors your database’s performance metrics, query logs, and current configuration settings.
- ML Analysis: This data is sent to a cloud-based machine learning engine that analyzes your specific workload to identify improvement opportunities.
- Actionable Recommendations: The system generates precise configuration changes designed to increase performance, reduce costs, or both.
- Automated Application: Recommendations can be sent to your team for review or applied automatically, creating a continuous optimization loop.
This provides your team with a "superpowered DBA" that works 24/7, constantly adjusting the database to adapt to changing traffic and application behaviors.
The Business Case for Automated Optimization
The results from AI-driven tuning are not minor tweaks; they are significant leaps in efficiency. Real-world production environments are reporting staggering gains. For example, some AI tuning products claim up to a 400% performance improvement and a 50% cost reduction. Others have reported performance boosts of 318% for PostgreSQL and 195% for MySQL. You can explore the data and AI auto-tuning insights from Benchant.com.
The real value of AI in database tuning is giving you back your most valuable resource: your engineers' time. Instead of spending hours digging through execution plans and tweaking parameters, your team can get back to building features that actually grow the business.
Automating routine tuning tasks results in a faster database, a more productive team, and a lower risk of human error. It is a clear win for any company aiming to scale without expanding its operations team. Learning how to use AI in business can create similar advantages across your entire tech stack.
Integrating one of these tools into your DevOps workflow helps maintain a high-performance database without high operational overhead. This makes AI an essential component of any modern db performance tuning strategy, especially for fast-growing SaaS, e-commerce, and fintech companies where every millisecond of performance impacts the bottom line.
Building a Proactive Monitoring and Alerting System
After optimizing queries and tuning configurations, the final step is to establish a system that maintains performance over the long term. Great database performance is not a one-time achievement but a continuous practice that requires constant attention.
This involves shifting from reactive firefighting to a disciplined, proactive approach to db performance tuning. The goal is to create a framework that flags potential issues long before they become production outages. It begins with continuous observation and establishing a baseline for what "normal" looks like for your system.
Key Metrics for Long-Term Tracking
To maintain database health, you need a dashboard providing an immediate, at-a-glance overview of its vital signs. This is not about tracking every possible metric but focusing on the few that are true indicators of trouble.
Your monitoring toolkit should include these essentials:
- CPU and Memory Utilization: Sustained high usage is a classic sign of an overworked server, often pointing to inefficient queries or insufficient hardware resources.
- Disk I/O and Latency: Spikes here can expose serious storage bottlenecks. Slow disk reads directly translate to slow queries.
- Active Connections: A sudden, unexpected jump in connections is a major red flag, potentially indicating a connection leak in your application or a denial-of-service attack.
- Slow Query Logs: Continuously monitor the queries that take the longest to execute. New entries on this list are your next optimization targets.
- Cache Hit Ratio: A sudden or steady drop indicates your database is accessing slow disk more often than it should, bypassing faster memory caches.
From Dashboards to Actionable Alerts
Visualizing these metrics on a dashboard with tools like Prometheus and Grafana is a great first step. For a deeper dive, review our guide on infrastructure monitoring best practices. However, dashboards are passive. Alerts are what make your system truly proactive.
The key is to set up intelligent alerts based on anomalies, not static thresholds. For example, an alert for "CPU usage is 20% higher than the 7-day average for this time of day" is far more valuable than a noisy "CPU is over 90%."
This approach to smart alerting prevents alert fatigue and ensures your team responds only to genuine issues. A well-configured system acts as an early warning mechanism, helping you identify and fix performance degradation before it impacts customers. This is how you embed performance as a core, protected feature of your application.
Summary and Next Steps
Mastering db performance tuning is a continuous, strategic discipline that directly impacts business success. By moving from a reactive to a proactive mindset, you can build applications that are not just fast but also resilient and scalable.
The process involves four key pillars:
- Diagnose: Use execution plans and key metrics to pinpoint bottlenecks.
- Optimize: Rewrite inefficient queries and implement a strategic indexing strategy.
- Configure: Tune memory parameters and use connection pooling to maximize hardware efficiency.
- Monitor: Implement continuous monitoring and intelligent alerting to stay ahead of issues.
Actionable Next Steps:
- Audit Your Slow Query Log: Identify your top 3 most resource-intensive queries and analyze their execution plans this week.
- Review Your Indexing Strategy: Look for missing indexes on frequently queried columns and identify any unused indexes that can be removed.
- Evaluate Your Monitoring System: Ensure you have alerts configured for key metrics like CPU utilization, I/O latency, and cache hit ratio.
- Explore AI-Powered Tuning: Investigate tools like OtterTune to see how automation can enhance your performance optimization efforts.
Ready to build a high-performance application with a world-class engineering team? Group 107 provides dedicated offshore developers who specialize in creating scalable, optimized, and secure digital solutions. We help you accelerate your roadmap while significantly reducing development costs.