
Your application is loading slowly. Support tickets are coming in. Synthetic checks show intermittent failures. A customer refreshes the page and sees connection timed out instead of a dashboard, checkout, or account screen.
At that point, this isn't a browser annoyance. It's an availability incident.
Most articles on connection timed out errors stay at the browser layer. Clear cache. Restart the router. Disable the VPN. Those steps have their place, but they don't help much when the actual problem lives in your firewall policy, reverse proxy, overloaded app tier, thread pool, or upstream dependency chain. In SaaS, fintech, and enterprise systems, the fix has to be systematic.
Beyond the Browser Why Connection Timed Out Matters for Business
At 9:07 a.m., your login service starts timing out for a subset of customers. The app is still up. CPU looks acceptable. Basic uptime checks stay green. Revenue still drops, support volume spikes, and your incident channel fills up because users cannot open a session in the first place.
A connection timed out error means the client waited for a network connection that never completed. The request did not reach the point where normal application logic could run. In practical terms, the failure often happens before authentication, checkout logic, dashboard rendering, or API processing can begin.
That distinction matters in production. A 504 Gateway Timeout means one system connected to another system and then waited too long for a response. A connection timeout usually points earlier in the path: DNS resolution, routing, firewall policy, load balancer behavior, a closed or filtered TCP/IP port, SYN packet loss, or an overloaded service that cannot accept new connections fast enough.

The business impact starts before the incident is declared
In SaaS and enterprise systems, connection timeouts break the front door. Users cannot sign in, payment providers cannot call back, mobile apps cannot refresh tokens, and internal services start failing health checks against each other. That creates an outage pattern that looks random to customers and expensive to operators.
The pressure hits several teams at once:
- Revenue stalls: checkout, onboarding, and API transactions fail before they enter the application flow.
- Support queues grow: customers report an unavailable product, not a network path issue.
- On-call risk rises: engineers make fast changes to edge rules, autoscaling, or proxy settings with limited evidence.
- Trust drops: repeated timeout errors during account access or payment steps are treated as reliability failures.
For high-stakes systems, that business cost is usually larger than the raw error count suggests. A timeout on a status page link is annoying. A timeout on login, card authorization, SSO, or partner API traffic can violate SLAs, delay settlements, and trigger incident reviews from customers who expect predictable uptime.
Search and partner integrations can fail quietly
Timeouts do not only hurt interactive users. They also break machine-to-machine traffic.
Search crawlers, webhooks, integration partners, and background workers all depend on stable connectivity. If crawlers cannot connect, updated pages may not be fetched. If a webhook sender times out, retries can pile up and create duplicate processing risk. If an enterprise customer connects through fixed outbound IPs and your edge intermittently drops those sessions, the issue may stay invisible until account teams escalate it.
This is why I treat connection timeout rates as an infrastructure reliability signal, not just a help desk symptom.
Mature teams respond at the stack level
Teams that run business-critical platforms do not stop at browser advice because browser advice does not explain why only one region fails, why a WAF blocks a payment callback, or why an app tier accepts connections during low traffic but times out under queue saturation.
The fix usually spans multiple layers. Edge network policy, load balancer timeouts, reverse proxy connection limits, container health checks, upstream pool exhaustion, and application retry behavior all play a part. Good operations teams reduce mean time to resolution by correlating these signals instead of guessing from a screenshot.
If you are tightening detection and response around these failures, this guide on infrastructure monitoring best practices is a useful companion.
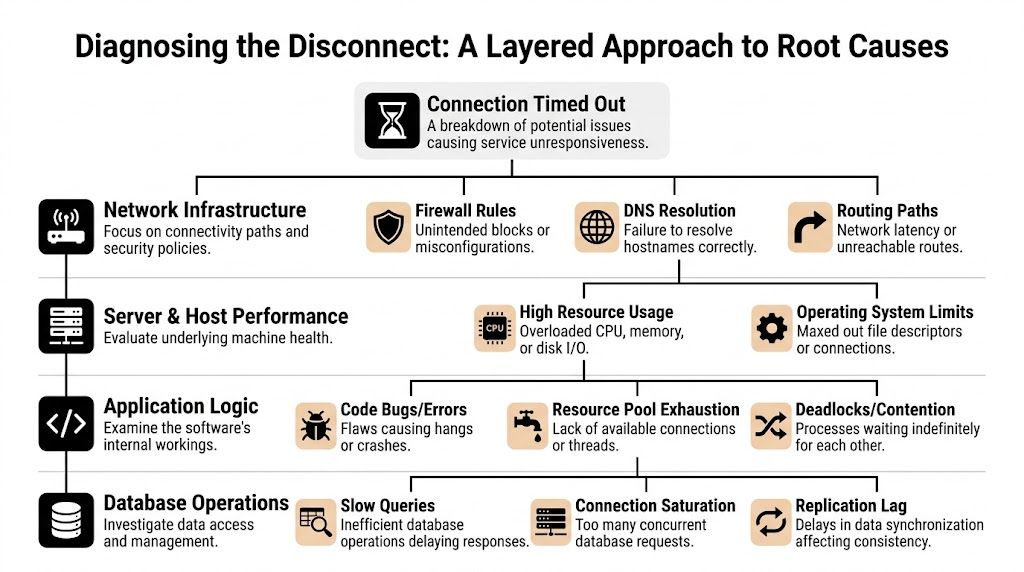
Diagnosing the Disconnect A Layered Approach to Root Causes
A customer in one region cannot complete checkout. Synthetic monitoring stays green from two other regions. The load balancer shows healthy targets, but payment callbacks are timing out and retry queues are growing. That is a layered failure, and the only reliable way to diagnose it is to isolate where the request stops moving.
When I work a timeout incident, I break it into four domains. Client and network. Infrastructure edge. Server and host. Application and data path. That structure cuts through guesswork and keeps teams from changing proxy settings when the underlying problem is a dropped SYN, a bad route advertisement, or an exhausted connection pool.
Client and network layer
Start from the caller's side and verify whether the request can reach your edge at all.
Timeouts that affect one office, one enterprise customer, or one geography often come from path issues outside your platform. Common causes include stale DNS answers, asymmetric routing, provider filtering, and corporate egress controls that drop outbound sessions unacknowledged. In SaaS and fintech environments, these incidents matter because they can hit a specific high-value customer while every broad health check still reports normal service.
Look for these patterns:
- Scope mismatch: One site or ASN fails while other networks connect normally.
- Route instability: Packets disappear before they reach your CDN, WAF, or load balancer.
- DNS split behavior: Different resolvers return different targets, or clients keep using expired records.
- Security appliance interference: Enterprise proxies and outbound filters block traffic without returning a clear refusal.
If your team needs a refresher on routing, segmentation, and transport flow, this guide to the components of a computer network gives the right baseline.
Infrastructure edge layer
A large share of timeout incidents lives here.
The edge accepts the blast radius for configuration drift, partial rollouts, and policy mistakes. Load balancers, reverse proxies, CDN rules, WAF policies, NAT gateways, and security groups can all cause a client to hang even when the application is healthy. I see this often during migrations, TLS changes, and regional failover tests, where one listener or target group is misaligned and only part of the traffic path breaks.
Common failure modes include:
- Firewall or security group rules that block expected traffic between tiers
- WAF false positives that drop legitimate payment, API, or webhook requests
- Listener and backend mismatches involving TLS termination, host headers, or backend protocol selection
- Timeout mismatch across tiers where the proxy, load balancer, and upstream app all wait for different intervals
- Connection tracking or SNAT exhaustion that appears only under burst traffic
Engineers who only inspect HTTP logs miss many of these cases. A timeout can happen before the application ever sees the request. If you need a practical refresher on how services bind and accept traffic, the role of a TCP/IP port is directly relevant.
A timeout usually means packets were dropped, ignored, or never forwarded. A refusal means the network path worked and nothing accepted the connection on the destination port.
Server and host layer
Once traffic reaches the instance or node, the operating system still has to accept it, queue it, and hand it to the process.
Resource pressure often appears to be a network problem. High CPU can delay accept loops. Memory pressure can trigger reclaim and swapping. File descriptor limits, conntrack pressure, SYN backlog overflow, and local firewall rules can all produce the same user symptom. The browser says "connection timed out." Frequently, the underlying issue is a host that is alive but unable to keep up.
Check these areas first:
- CPU saturation and run queue length
- Memory pressure, swapping, and OOM activity
- Open file and socket limits
- Kernel backlog and connection table pressure
- Host firewall state such as
iptables,nftables, or cloud-init rules that differ from the intended design
In enterprise systems, this layer often fails gradually. Latency climbs, queues deepen, and only then do timeouts appear. That is why host metrics need to be reviewed alongside connection errors, not after them.
Application and data layer
If the network path is clean and the host is reachable, the request is usually blocked inside the service path.
The usual causes are slow database queries, lock contention, thread starvation, dead upstream dependencies, exhausted worker pools, and client libraries reusing connections poorly under load. These are expensive failures because they often pass basic health checks while degrading checkout flows, auth callbacks, reporting jobs, or partner API traffic.
Four patterns show up repeatedly in production:
- Database work that holds request threads too long
- Connection pool exhaustion in the app, database, or HTTP client
- External API calls without strict time limits and fallback behavior
- Serial dependency chains where one slow hop stalls the full request
A recurring example is SDK or HTTP client reuse that looks efficient but breaks under concurrency or long-lived sessions. Teams often label this a network issue because the visible symptom is a timeout. The fix is usually in application behavior: set explicit connect and read timeouts, cap retries, refresh stale pooled connections, and instrument each upstream call so you can see where the time was spent.
The Troubleshooter's Toolkit Step-by-Step Diagnostic Commands
A timeout in production is rarely a single symptom. In a SaaS login flow, it can block revenue. In fintech, it can stall payment authorization or webhook delivery. In an enterprise integration, it can back up queues and trigger SLA breaches. The job during incident response is to identify the failing layer fast and gather evidence that another team can act on without repeating your work.
Start with commands that narrow the blast radius. The sequence matters because each check removes a class of failure.
| Tool | Primary Use Case | When to Use It | Example Command |
|---|---|---|---|
ping |
Basic reachability and latency signal | First pass to see whether the host responds to ICMP | ping your-service-host |
traceroute or tracert |
Path visibility between source and destination | Regional or site-specific failures | tracert your-service-host |
nc |
TCP port reachability | Verify whether a service is accepting connections on a specific port | nc -zv your-service-host 443 |
curl -v |
HTTP(S), TLS, redirects, and response timing | DNS resolves but requests still hang or fail | curl -v https://your-service-host/health |
Start with reachability, but don't stop there
ping is useful as a quick signal, not a verdict.
A successful reply shows that ICMP reached the host or something in front of it. It does not confirm that your application port is open, your load balancer is healthy, or your service thread pool has capacity. A failed ping is also inconclusive because many production networks block ICMP by policy as part of their network security controls.
Use it to answer a narrow question. Does anything on the path respond, and is latency stable enough to rule out obvious packet loss or major congestion?
Trace the path from the failing network
For office-specific, ISP-specific, or region-specific incidents, traceroute or tracert often gives the first usable escalation evidence.
Run it from the affected location, not just from a healthy laptop on another network. Then compare it with a cloud VM in the same region as your service and, if needed, a mobile hotspot. That comparison shows whether traffic dies before your edge, at a transit provider, or near the destination network. Save the raw output. NOC teams and cloud support engineers can work with that.
Example patterns:
- Healthy enough: hops progress to the destination or to the provider edge consistently
- Path issue likely: traces from one network stall repeatedly at the same upstream hop
- Ambiguous result: intermediate hops stop answering, but later hops still complete. Some routers de-prioritize ICMP, so read the full path before escalating
Test the port that actually matters
Timeouts become much easier to classify once you test the target port directly.
nc -zv your-service-host 443
nc -zv your-service-host 22
Interpret the result carefully:
- Succeeded or connected: the TCP path to that port works. Shift focus to TLS, HTTP behavior, proxying, or application processing.
- Connection refused: the packet reached the host, but nothing accepted the connection on that port. Look for a dead listener, wrong bind address, failed deployment, or misrouted load balancer target.
- Timed out: packets were dropped, filtered, or never reached a listening service.
That distinction matters during incidents. A refused connection usually points to service state. A timed out connection usually points to the path, firewall policy, security group drift, or edge routing.
Inspect the handshake with curl
curl -v is one of the fastest ways to see where a request stops progressing.
curl -v https://your-service-host/
Verbose output shows DNS resolution, TCP connect, TLS negotiation, request headers, redirects, and the beginning of the response. That makes it useful across both infrastructure and application triage.
Watch for these patterns:
- DNS resolves, then connect hangs: suspect routing, security controls, listener issues, or an unhealthy load balancer target
- TCP connects, then TLS stalls: inspect certificates, SNI handling, TLS versions, proxy config, and edge termination
- Headers return slowly or body transfer hangs: inspect upstream latency, worker saturation, queue depth, and database performance
For application teams, this is usually the handoff point to tracing and backend metrics. If the request reaches the service but never completes, review slow queries, lock waits, and connection pool behavior. Teams debugging timeout-heavy APIs often need both request traces and a database-focused checklist such as this guide to database performance tuning for production systems.
Correlate command output with logs and timestamps
Command-line checks are only half the job. The other half is matching them to server-side evidence.
If nc times out at 14:03:12 UTC, check firewall change history, load balancer target health, and host metrics at that timestamp. If curl -v connects and then stalls, line that up with reverse proxy logs, application traces, and database wait events. In mature environments, this correlation is what separates a five-minute diagnosis from an hour of finger-pointing.
A simple incident workflow helps:
- One user or one office affected: check local DNS, VPN, proxy, and ISP path
- One region affected: check CDN behavior, WAF policy, regional load balancers, and edge routing
- All traffic affected: check recent deploys, listener health, firewall changes, and host saturation
- Only one endpoint affected: inspect application logs, dependency calls, query latency, and worker pool exhaustion
- Only HTTPS affected: inspect TLS termination, certificate validity, SNI, and proxy configuration
Run the commands in order. Save the output. Time-stamp everything. That discipline turns "connection timed out" from a vague complaint into evidence your infrastructure, platform, and application teams can act on immediately.
Implementing Targeted Fixes From Firewall Rules to Application Retries
A timeout during a checkout flow, payment authorization, or SSO login is not a cosmetic bug. It is a dropped transaction, a support ticket, and a credibility hit. Once the failing layer is identified, fix the smallest component that explains the failure and verify it from the same path that produced the timeout.
Longer timeout values have a cost. They hold open worker threads, database connections, sockets, and queue consumers. In SaaS and fintech systems under load, that choice can turn one slow dependency into a wider incident.
Fix the network path before touching app code
If traffic never reaches the service, retry logic and controller optimizations will not matter.
Start at the boundary where requests first enter the system and work inward. Check whether the expected source ranges can reach the port. Confirm host firewalls such as iptables or ufw still match cloud security group policy. Verify load balancer listeners, target groups, and health checks are using the right protocol and port. Then inspect WAF behavior for silent drops caused by geo policies, bot rules, or rate controls.
Teams that split controls across cloud networking, host policy, and edge filtering need a clean ownership model. It helps to separate network security controls from application-layer protections so timeout incidents do not turn into a debate about which team owns the packet path.
Tune reverse proxy behavior with intent
Reverse proxy timeouts should match the service contract, not guesswork.
For NGINX, common settings include:
proxy_connect_timeoutproxy_send_timeoutproxy_read_timeout
An example pattern looks like this:
location /api/ {
    proxy_pass http://app_backend;
    proxy_connect_timeout 60s;
    proxy_send_timeout 60s;
    proxy_read_timeout 60s;
}
Use short values for health checks, auth calls, and lightweight APIs where fast failure protects capacity. Use longer read timeouts only for endpoints that legitimately stream large responses or wait on asynchronous backends. If the proxy waits 60 seconds, the app server gives up at 30, and the client aborts at 15, the stack is misconfigured even if each individual value looks reasonable.
If the only change is raising timeout values, the root cause probably still exists.
Fix application bottlenecks, not just symptoms
Application-level timeouts usually come from blocked work, exhausted pools, or slow dependencies. Those problems get worse as concurrency rises.
The fixes that hold up in production are usually architectural, not cosmetic:
- Break up long-running requests: push heavy work to queues and return a job ID or status endpoint.
- Size connection pools carefully: enough to handle normal concurrency, small enough to avoid crushing the database during spikes.
- Bound every dependency call: HTTP clients, database queries, cache lookups, and message brokers all need explicit timeout values.
- Use circuit breakers and fallbacks: protect the service when one dependency starts hanging.
- Profile hot paths: find lock contention, slow queries, CPU-heavy serialization, or thread pool starvation.
One pattern I have seen repeatedly is client reuse becoming a liability. A shared SDK client can look efficient in tests, then start timing out in production because of stale connections, throttling behavior, or poor pooling behavior under parallel load. In those cases, changing client lifecycle or connection management can remove the timeout without touching the endpoint itself.
Example refactor pattern:
var connection = new VssConnection(uri, creds);
var client = connection.GetClient<TfvcHttpClient>();
await client.GetItemContentAsync(path);
Use that pattern when reuse causes connection exhaustion or unstable behavior. Do not apply it blindly. Creating fresh clients per request can also increase handshake overhead and socket churn. Measure both sides before standardizing on either approach.
Implement retries that help instead of hurt
Retries should reduce user-visible failures without multiplying load on a struggling service.
For idempotent operations, use a small retry budget with exponential backoff and jitter:
- first retry after a short delay
- second retry after a longer delay
- stop after a small number of attempts
- add jitter so clients do not retry in lockstep
Pseudo-code:
async function fetchWithRetry(fn, retries = 3) {
  let delay = 1000;

  for (let attempt = 1; attempt <= retries; attempt++) {
    try {
      return await fn();
    } catch (err) {
      if (attempt === retries) throw err;
      await new Promise(resolve => setTimeout(resolve, delay));
      delay *= 2;
    }
  }
}
Apply retries to transient transport failures, brief upstream saturation, and connection resets. Do not retry bad credentials, malformed payloads, validation failures, or non-idempotent payment actions unless the workflow has explicit deduplication and idempotency keys. In enterprise systems, retrying the wrong request can create a larger problem than the original timeout.
Match the fix to the failure mode
The fastest teams map each timeout pattern to a concrete intervention.
| Failure mode | Likely fix |
|---|---|
| Port silently drops traffic | Adjust firewall, security group, WAF, or routing policy |
| TLS handshake stalls | Validate certificate path, SNI handling, proxy termination |
| Reverse proxy waits too long on backend | Tune proxy and app timeouts, then optimize backend work |
| Application hangs under concurrency | Increase resilience in pools, workers, locks, and dependency calls |
| Batch API calls degrade after early success | Refactor client lifecycle, avoid unsafe connection reuse |
Change one thing at a time. Retest from the same client path, region, and endpoint. That discipline keeps timeout remediation tied to evidence instead of guesswork.
From Reactive to Proactive DevOps Strategies for Preventing Timeouts
A stable platform doesn't rely on heroics during incidents. It makes timeout conditions visible early, absorbs normal spikes, and catches risky changes before they hit users.

Monitor the signals that predict failure
Most timeout incidents leave warning signs before the outage becomes obvious.
Track these as first-class operational metrics:
- Latency by endpoint and region
- Connection error rates
- Proxy upstream timing
- CPU, memory, and file descriptor pressure
- Database wait time and pool saturation
- External dependency latency
- WAF and edge rejection patterns
Prometheus, Grafana, Datadog, New Relic, and cloud-native telemetry stacks all work if the team uses them consistently. The exact tool matters less than whether engineers can correlate a timeout spike with host stress, deployment changes, and upstream behavior within minutes.
Design for bursts, not average load
Many platforms look healthy during normal traffic and fail during launches, billing runs, campaigns, or batch jobs.
That is why scaling policy matters. Auto-scaling groups, Kubernetes Horizontal Pod Autoscalers, queue-based workers, and CDN offload all reduce the odds that one traffic spike turns into widespread connection timed out errors.
A few hard-won principles:
- Scale stateless services horizontally
- Keep health checks lightweight
- Protect databases from uncontrolled fan-out
- Cache expensive reads where it makes sense
- Separate synchronous user flows from background processing
Build timeout prevention into delivery pipelines
CI/CD should do more than deploy code. It should prevent avoidable regressions.
That means adding:
- Load tests for high-risk endpoints
- Smoke tests that validate connection behavior after deploy
- Canary or blue-green rollout patterns
- Config validation for edge and proxy changes
- Automated rollback triggers for rising timeout error rates
One Azure DevOps-specific issue deserves attention in this context. A common production headache involves git pull failing over HTTPS because of Server Name Indication mismatches across networks. Microsoft community guidance shows that switching Git operations to SSH resolves over 90% of these cases because SSH avoids the problematic TLS negotiation path (Azure DevOps HTTPS timeout guidance).
That isn't just a Git tip. It's an operational lesson. Standardize the transport mechanisms in your build and deployment pipelines so you don't inherit flaky behavior from inconsistent network conditions.
Reliable systems don't just recover from timeouts. They reduce the number of places where timeouts can start.
The mature posture
Reactive teams ask, “Why did this request fail?”
Proactive teams ask:
- which metric would have warned us sooner
- which dependency should fail faster
- which edge rule is too opaque
- which deployment path lacks a rollback guard
- which workflow needs asynchronous design instead of longer waits
That shift is what turns timeout handling from incident response into platform engineering.
Frequently Asked Questions About Connection Timeouts
Is connection timed out the same as 504 Gateway Timeout
No.
A connection timed out error means the client couldn't establish the connection in time. A 504 Gateway Timeout means a server acting as a gateway or proxy connected successfully but waited too long for an upstream response.
That difference matters because the investigation path changes. Connection timed out pushes you toward network path, firewall, listener, TLS, and host acceptance. A 504 pushes you toward reverse proxy behavior and backend processing.
Can a VPN cause a connection timed out error
Yes. It can also appear to solve one.
A VPN changes the route, egress policy, latency profile, and sometimes DNS behavior. That can bypass a bad ISP path or trigger a different firewall decision. It can also make things worse if the exit node is congested or blocked by the destination environment.
The practical test is simple. Compare results from the normal network, the VPN, and another external path such as a mobile hotspot or cloud VM.
Why does one specific website time out on every browser
When only one site fails across multiple browsers, the problem often isn't the browser. It may be route-level filtering, provider-side blackholing, stale pathing, or an edge security rule affecting that destination only.
In those cases, tracert and curl -v are usually more useful than clearing browser cache. If the failure reproduces across devices on the same network, collect route evidence and escalate with specifics.
Should I just increase server timeout values
Usually not as a first move.
Increasing timeouts can reduce false alarms for legitimately long operations, but it's a poor primary fix for unhealthy systems. If the root cause is blocked traffic, CPU saturation, lock contention, pool exhaustion, or a dead upstream dependency, longer timeouts often increase pressure and make recovery slower.
Adjust timeout values only after you know which component is waiting and why.
What's the fastest way to isolate the problem layer
Use a simple ladder:
- test from another network
- run
tracert - test the target port with
nc - inspect the handshake with
curl -v - correlate with edge, host, and app logs
That sequence usually tells you whether you're dealing with a client path issue, edge control issue, host resource issue, or application bottleneck.
If your team is dealing with recurring timeout incidents, unstable deployments, or scaling pressure in a SaaS, fintech, or enterprise platform, Group 107 can help you tighten the full chain from infrastructure and CI/CD to application performance and operational resilience.