
If you’ve been in the analytics game for a while, you know the term bounce rate. It’s the classic metric for single-page sessions—where a user lands on your site and leaves without a second click. But its meaning has completely changed with the move from Universal Analytics (UA) to Google Analytics 4 (GA4).
What was once a simple (and often misleading) metric is now tied to a much smarter concept: engagement rate. This shift isn't just a name change; it's a fundamental rethinking of how we measure user behavior. Understanding this evolution is critical for any business—from a SaaS company measuring user journeys to an e-commerce brand optimizing product pages—to accurately assess content performance and user experience.
The Evolution of Bounce Rate: From UA to GA4
To master bounce rate today, you must understand its past. The old definition in Universal Analytics caused widespread misinterpretation, often leading to poor strategic decisions. The new model in GA4 provides a far more accurate and actionable picture of how users engage with your digital products and content.

The Old Way: Universal Analytics
In the era of Universal Analytics—which Google sunsetted in July 2023—bounce rate was defined by a single, rigid rule: if a session involved only one pageview, it was a bounce. Period.
This created seriously misleading data. Imagine a developer landing on a detailed post about offshore DevOps solutions. They spend five minutes reading every word, find the exact technical solution they need, and close the tab. In UA, that was recorded as a 100% bounce. It looked like a failure, but it was a resounding success.
This model was a poor fit for the modern web, where single-page interactions can be highly valuable.
Here are a few real-world examples where UA's bounce rate provided a flawed signal:
- Finding an Answer: A user reads a comprehensive blog post that perfectly answers their question and leaves satisfied. UA called this a bounce.
- Grabbing Information: A potential customer lands on your contact page, copies the phone number, and closes the window to call you. Another bounce.
- Technical Deep Dives: A developer studies your API documentation for ten minutes before heading back to their own code editor. That was also a bounce.
The old model couldn't distinguish between a disappointed user and an efficiently served one, making it a poor metric for assessing business impact.
The New Way: Google Analytics 4
Google Analytics 4 flips the script entirely. Instead of punishing single-page sessions, GA4 focuses on a positive signal: user engagement. It introduced Engagement Rate as a primary metric, and bounce rate is now simply its inverse.
Bounce Rate in GA4 = 100% – Engagement Rate
So, what counts as an "engaged session" in GA4? A session is considered engaged if it meets at least one of these conditions:
- It lasts longer than 10 seconds (a duration you can customize).
- It includes at least one conversion event (like a form submission or download).
- It involves two or more pageviews.
If a user session doesn't meet any of these criteria, then it’s counted as a bounce. This is a game-changer. That developer who spent five minutes on your DevOps blog? They are now correctly identified as an engaged user, not a bounce.
This table breaks down the measurement approaches for clarity.
Bounce Rate Measurement: Universal Analytics vs. GA4
| Metric Aspect | Universal Analytics (UA) | Google Analytics 4 (GA4) |
|---|---|---|
| Core Concept | A session with only one pageview, regardless of time spent. | A session that was not engaged. |
| Calculation | (Single-Page Sessions) / (Total Sessions) | 100% – Engagement Rate |
| Primary Focus | Negative (user left after one page). | Positive (user interacted meaningfully). |
| Context | Lacks context for time-on-page or interaction on that single page. | Considers time, conversions, and multiple pageviews. |
| Common Misinterpretation | High bounce rate was always seen as bad, even for blogs or contact pages. | High bounce rate accurately signals a lack of meaningful interaction. |
This evolution is a major win for any business looking to understand true user behavior, whether it's a startup refining its web development lifecycle or an enterprise measuring content ROI. By focusing on valuable interactions instead of just clicks, we can finally get an accurate read on what's working.
When a High Bounce Rate Is a Good Sign
For years, marketers viewed a high bounce rate as an automatic failure. The logic was simple: if someone lands on a page and leaves, the page must be bad. But that's a narrow, and often incorrect, way to interpret your bounce rate Google Analytics data.
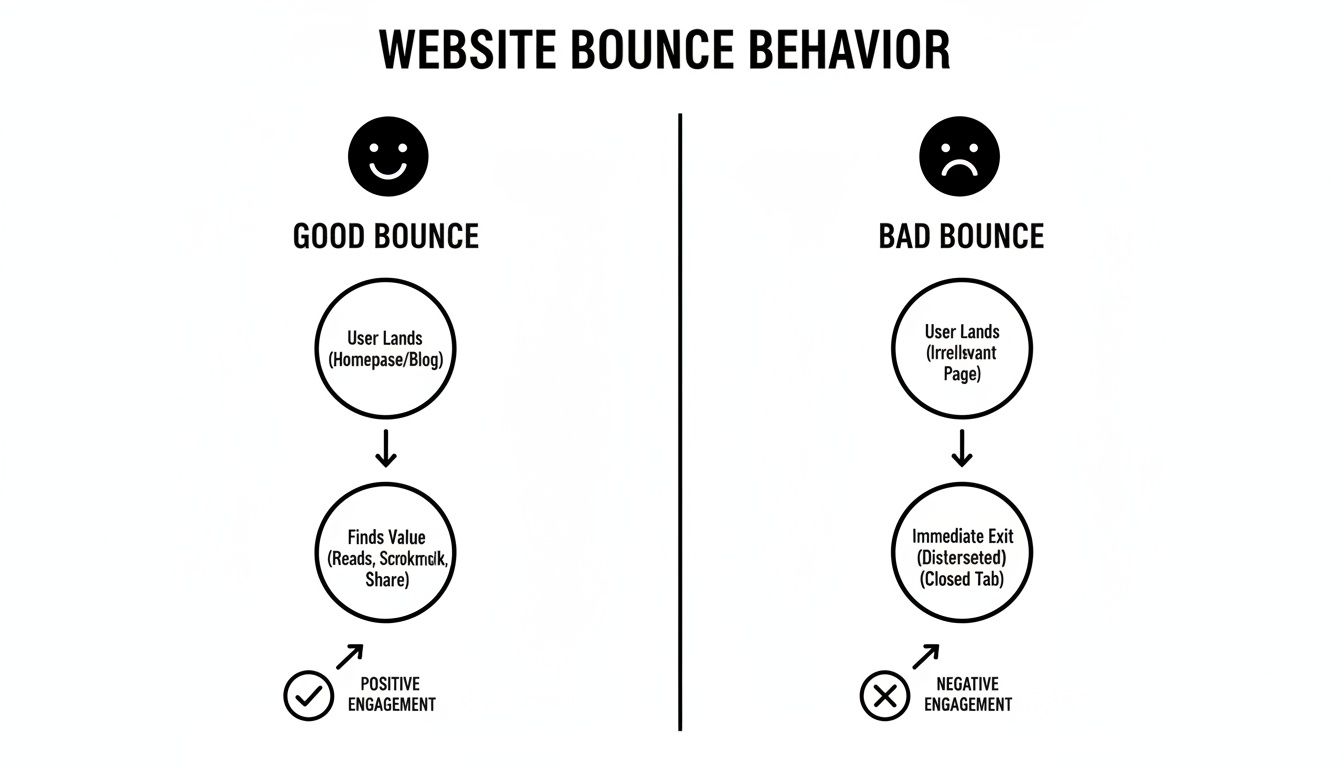
A high bounce rate isn't always a problem—it can be a sign of success. It means the visitor got exactly what they needed so efficiently that they didn't need to click anything else. The key is to differentiate between a "good bounce," where the user is satisfied, and a "bad bounce," where they leave frustrated.
The "Good Bounce": When User Intent Is Met Instantly
A good bounce occurs when your page delivers its full value on the spot, making further action unnecessary. The visitor’s journey concludes because their goal was met, not because they were disappointed.
Consider these common scenarios where a high bounce rate is a positive signal:
- Contact and Location Pages: A potential customer lands on your contact page, copies your phone number, and closes the tab to call you. That’s a bounce, but it's one that could directly lead to a sale.
- Informational Blog Posts: A developer lands on your article explaining how to set up a CI/CD pipeline. They read the guide, get their answer, and return to their work. Your content did its job perfectly, establishing you as a trusted resource.
- Pricing and Feature Lookups: A product manager lands on your pricing page, confirms a specific feature is included in a plan, and leaves to discuss it with their team. The bounce was a success.
- Financial Calculators or Tools: A user visits a loan calculator on your finance site, gets the figures they need, and leaves. The interaction was quick, valuable, and complete.
In each case, the user left happy. Obsessing over lowering the bounce rate on these pages would likely mean making them harder to use.
A high bounce rate isn't always a red flag. It can indicate that a user found their answer so efficiently that they didn't need to click anything else. This is a sign of successful content, not a failing page.
Bad Bounce vs. Good Bounce Analysis
To drive real business outcomes, you must understand the why behind the bounce. A bad bounce is caused by poor user experience, broken links, slow load times, or misleading content. A good bounce is the opposite. For product managers and marketers at any tech, SaaS, or e-commerce company, telling them apart is crucial for effective optimization.
Instead of panicking over a page with a 70% bounce rate, analyze its purpose. Is it a landing page designed to capture leads, or is it a support document? A high bounce rate on your checkout page is a critical issue. On a blog post, it might be perfectly normal. This distinction prevents "fixing" things that aren't broken and focuses your resources on optimizations that drive revenue.
How to Audit and Diagnose High Bounce Rates
Once you've determined a high bounce rate is a problem, not a sign of efficiency, the real work begins. To diagnose the root cause, you must move beyond site-wide averages and dig into your bounce rate Google Analytics data. The mission is to segment your traffic and uncover the patterns that explain why users are leaving.
This is a data-driven process, not guesswork. A high overall bounce rate is merely a symptom; the real story is buried in the details of specific traffic segments, landing pages, and user behaviors.
Your Step-by-Step Diagnostic Framework
A proper audit requires slicing your analytics data from multiple angles. This is where foundational knowledge in data analytics for small businesses becomes invaluable, as the principles of interrogating data apply at any scale.
Here's a structured approach to hunt down the source of the problem:
- Segment by Traffic Source and Medium: Are visitors from organic search bouncing more than those from paid campaigns? A high bounce rate from a specific source often signals a disconnect between your marketing message and the landing page experience.
- Analyze by Device Category: Compare bounce rates across desktop, mobile, and tablet. A significantly higher mobile bounce rate is a clear indicator of a poor mobile experience, slow load times, or a non-responsive design.
- Drill Down into Landing Pages: Sort your pages by bounce rate from highest to lowest. Pages with both high traffic and a high bounce rate are your top priority—these are the "leakiest buckets" you need to fix first.
- Cross-Reference with Browser Data: Occasionally, a high bounce rate is tied to a specific browser like Chrome, Safari, or Firefox. This almost always signals a technical bug or rendering issue for your development team to investigate.
Pinpointing Underperforming Pages and Content
After identifying your problem pages, the investigation shifts from where the issue is to why it’s happening. A high bounce rate on a page designed to drive action is a direct symptom of a broken user experience. If you need a refresher on the fundamentals, it's worth understanding what user experience design is.
Don't just look at what the bounce rate is; ask what it implies. A high bounce rate on a product page could mean the price is too high, the images won't load, or the description is unclear. Each possibility requires a different solution.
To diagnose the "why," combine your GA4 data with qualitative and technical tools:
- Check Page Load Speed: Use a tool like Google PageSpeed Insights. Slow-loading pages are a primary cause of bounces. A visitor forced to wait more than a few seconds is a visitor who is about to leave.
- Review with Heatmaps and Session Recordings: Tools like Hotjar or Clarity are essential for this. They let you see exactly where users click, how far they scroll, and where their mouse hovers. A session recording might show a user furiously clicking a non-clickable image, providing a clear picture of their frustration.
- Evaluate Content and Search Intent: Read the page's content critically. Does it align with the keywords it's ranking for or the ad that sent the user there? If someone searches for "enterprise CI/CD solutions" and your page is a generic homepage, they’re gone.
For instance, an e-commerce product page with an 80% bounce rate might seem like a content failure. But a technical audit could reveal that its high-resolution photo gallery takes 10 seconds to load on mobile. Users aren't rejecting the product—they're abandoning the page before they even see it. That's an actionable insight you’d never get from a bounce rate Google Analytics report alone.
Actionable Strategies to Reduce Your Bounce Rate
You've analyzed the data and have a clear hypothesis about why users are bouncing. Now it’s time for execution. Lowering your bounce rate isn't about a single silver bullet; it's about a series of targeted improvements that enhance user experience and align with visitor intent.
Think of this work as a direct investment in your conversion funnel. Every disengaged visitor you convert into an engaged one is a potential lead or customer you just retained.
Enhance Page Speed and Core Web Vitals
A slow website is a conversion killer. If your page takes more than a few seconds to load, a significant portion of your traffic will leave before they even see your headline. Improving your site's Core Web Vitals (CWV) directly improves user experience and, by extension, lowers bounce rates.
Your development team should focus on these three key metrics:
- Largest Contentful Paint (LCP): How fast does the main content appear? Aim for 2.5 seconds or less.
- Cumulative Layout Shift (CLS): Does the page layout jump around while loading? A low CLS score prevents this user frustration.
- Interaction to Next Paint (INP): When a user clicks or taps, how quickly does the page respond? A fast INP makes your site feel fluid and responsive.
Optimizing these scores involves technical work like compressing images, leveraging browser caching, and minimizing server response times. It's a non-negotiable first step.
Refine Content to Match Search Intent
A high bounce rate is often a symptom of a broken promise. A user clicked a link expecting one thing and your page delivered another. To fix this, you must ensure your content immediately validates their decision to click.
Your headline and the first few sentences are your only shot. If visitors don't see their problem reflected back at them right away, they're bouncing back to the search results to find someone who gets it.
For example, if someone searches for "SaaS pricing models," they're looking for a comparative analysis. If your page only hard-sells your own software without explaining different models, you’ve failed to meet their intent.
Review your high-bounce pages and ask these questions:
- Does the main headline directly address the keyword they searched for?
- Is the most critical information visible above the fold?
- Does the content deliver on the promise made in your meta description or ad copy?
Nailing search intent builds trust and signals to both users and Google that your page is a high-value result.
Implement a Smart Internal Linking Strategy
A visitor should never hit a dead end. Internal links create pathways that guide users from one relevant page to another, turning a single-page visit into a deeper, more engaged session. This also helps spread SEO authority across your site.
- Be Contextual: Weave links naturally into your content where they provide genuine value.
- Use Descriptive Anchor Text: Replace generic phrases like "click here" with anchor text that sets a clear expectation, such as "read our case study on automation ROI."
- Link to High-Value Pages: Strategically guide users toward your most important conversion pages, like product demos, service offerings, or contact forms.
Optimize Calls-to-Action for Clarity
Every page needs a clear purpose. What is the single most important action you want the user to take next? Your call-to-action (CTA) must be clear, compelling, and easy to find. If your CTAs are vague or buried, users will default to the easiest action: leaving.
A/B testing is crucial here. Test different CTA copy, colors, and placements to see what drives clicks. Does "Request a Demo" outperform "See It in Action"? Does a high-contrast button increase conversions? Data, not assumptions, should guide these decisions. For a structured approach, applying conversion rate optimization best practices provides a solid framework for iterative improvement.
How to Report on Bounce Rate in Your GA4 Property
When you first explore a Google Analytics 4 property, you might notice bounce rate is missing from standard reports. GA4 prioritizes Engagement Rate to measure user interaction.
While engagement is a superior forward-looking metric, many teams need bounce rate for historical context and benchmarking. Fortunately, you can easily add bounce rate back into your GA4 reports. This allows you to view both metrics—engagement and bounce—side-by-side for a complete picture of user behavior.

Customizing Standard GA4 Reports
The fastest way to get bounce rate back on your dashboard is by adding it to the ‘Pages and screens’ report. This is the ideal view for spotting underperforming landing pages at a glance.
If you have Editor-level permissions, follow these steps:
- Navigate to Reports > Engagement > Pages and screens.
- Click the pencil icon (Customize report) in the top-right corner.
- In the right-hand panel, under
Report data, click Metrics. - Click Add metric, then find and select Bounce rate.
- Drag "Bounce rate" to position it next to "Engagement rate" for easy comparison.
- Click Apply, then Save, and select "Save changes to current report."
Now, your 'Pages and screens' report will permanently display bounce rate, providing an immediate view of this key metric.
Building a Custom Exploration Report
For more powerful, flexible analysis, use GA4’s Explorations tool. This feature allows you to build custom reports from scratch, creating a single source of truth for tracking bounce rates across different traffic sources, device types, or campaigns.
Here’s a quick guide to building a dedicated bounce rate report:
- Start a New Exploration: Go to the "Explore" section and select "Free form."
- Import Dimensions: Add the dimensions you want to analyze, such as
Landing page + query string,Session source / medium, andDevice category. - Import Metrics: Add the metrics you need, including
Bounce rate,Engagement rate,Sessions, andConversions. - Build the Report: Drag
Landing page + query stringinto the "Rows" field and your chosen metrics into the "Values" field.
By creating a dedicated exploration, you can save and share a report that directly addresses your team's questions about user disengagement. This avoids the need to re-customize reports and ensures everyone is looking at the same data.
This approach provides a dynamic and shareable dashboard. When you connect data insights to broader business goals, you drive smarter, faster decisions. To learn more about turning data into strategic assets, see our guide on building an effective business intelligence report.
Summary and Actionable Next Steps
We've covered what bounce rate means in a GA4 world, how to interpret it correctly, and the common pitfalls to avoid. Now, it's time to turn theory into a practical, repeatable game plan.
High-performing teams don't just analyze data; they act on it. Bounce rate is about context, and GA4’s engagement metrics provide a much smarter way to measure it. True optimization is a continuous cycle of analysis, hypothesis, testing, and iteration.
Your Quick-Start Optimization Checklist
Use this checklist to systematically address high-bounce-rate pages. It’s a simplified process for product and marketing teams who need to execute quickly.
- Step 1: Add Bounce Rate to GA4: Customize your "Pages and screens" report to view Bounce Rate and Engagement Rate side-by-side.
- Step 2: Identify High-Bounce, High-Traffic Pages: Filter your report to find pages with high traffic and a bounce rate that's well above your site average. Start there.
- Step 3: Segment Traffic: For each priority page, segment the traffic by source and device. Is mobile traffic the culprit? Is a specific marketing channel underperforming? Pinpoint where the experience is failing.
- Step 4: Form a Hypothesis: Based on your analysis, create a specific, testable hypothesis. For example: "Users are bouncing from our SaaS pricing page on mobile because the primary CTA is not visible without scrolling."
- Step 5: Implement and Test a Fix: Run an A/B test to validate your hypothesis. This could involve improving page speed, rewriting a headline, or repositioning a CTA.
- Step 6: Measure and Iterate: Monitor the page’s bounce rate in Google Analytics. If the numbers improve, apply that learning elsewhere. If not, form a new hypothesis and test again.
Your Plan for Today
Reading this article is the first step. Driving business impact is the goal.
Your objective isn't just to lower a number in a report; it's to create better user experiences that directly contribute to business growth. Each bounce you prevent is a potential customer retained.
Here’s your immediate action plan:
- Identify Your Top 5: Go into your GA4 property and find the five landing pages with the most traffic and highest bounce rates.
- Form One Hypothesis: Choose one of those pages. Develop a single, clear, testable reason why you believe users are leaving.
- Schedule the First Test: Block time on your calendar to implement a fix and launch an A/B test. Start small, prove the value, and build momentum.
Common Questions About Bounce Rate
When digging into bounce rate in Google Analytics, many questions arise, especially with the shift to GA4. Here are answers to the most common queries we hear from product and marketing teams.
What is a good bounce rate in GA4?
There is no universal "good" bounce rate. The ideal number is entirely dependent on context. Since GA4's bounce rate is simply the inverse of its Engagement Rate, a "good" rate for one page type can be terrible for another.
While you might see industry benchmarks suggesting a range of 50-70%, it's more effective to benchmark pages against your own site's average. A blog post will naturally have a higher bounce rate than a checkout page. Focus on identifying and improving the outliers on your own site.
I can’t find bounce rate in my GA4 reports. Where is it?
You're right—it's not included by default. When Google Analytics 4 was introduced, Google chose to feature "Engagement Rate" to encourage a focus on positive user interactions rather than quick exits.
However, bounce rate is not gone. You can—and should—add it to your standard reports for a more complete performance view. Simply customize a report like ‘Pages and screens’ to include the bounce rate metric, as detailed in the step-by-step guide above.
Is bounce rate an SEO ranking factor?
No, bounce rate is not a direct ranking factor in Google's algorithm. However, a high bounce rate is often a symptom of underlying issues that absolutely harm your SEO performance.
Think of it as a diagnostic signal. A high bounce rate often points to:
- Poor user experience: Slow page speed, clunky mobile design, or confusing navigation.
- Content-intent mismatch: The page doesn't deliver what the user expected from the search result.
- Low-quality content: The information is thin, unhelpful, or untrustworthy.
Fixing the root causes of a high bounce rate inherently improves your site's overall quality and user experience—which will positively impact your search rankings over time.
How can I lower the bounce rate on my landing pages?
First, ensure your landing page content perfectly matches the ad or link that brought the visitor. Any disconnect is a primary cause of bounces.
Next, focus on high-impact optimizations:
- Improve Page Speed: Make your page load faster, especially on mobile.
- Optimize the Mobile Experience: Ensure the page is fully responsive and easy to use on small screens.
- Clarify the Call-to-Action (CTA): Make your primary CTA prominent, clear, and compelling.
- Add Internal Links: Provide relevant internal links to guide users to other valuable content on your site, giving them a reason to continue their journey.
At Group 107, we help businesses turn data insights into real-world strategies that get results. Whether you need to build out your development team, get your DevOps in order, or fine-tune your digital presence, we provide the end-to-end expertise to make it happen. Learn more about how Group 107 can accelerate your success.