In today's market, a structured process for collecting and analyzing data is not a competitive advantage—it's a requirement for survival. This isn't theoretical; it's the practical engine that fuels measurable business growth. Whether you're a SaaS startup refining product-market fit or a fintech firm optimizing risk models, this process transforms raw numbers into actionable intelligence that directly boosts revenue, operational efficiency, and customer loyalty.
Why Your Business Needs a Data Strategy Now

A robust data strategy is the blueprint that connects your business objectives to your data operations. Without it, you are merely collecting information reactively—a common pitfall that leads to disconnected datasets, wasted engineering cycles, and significant missed opportunities. Instead of hoarding data, a deliberate strategy ensures you gather the right data to answer your most critical business questions.
For a SaaS company, this means analyzing the user onboarding funnel to pinpoint drop-off points, fix friction, and reduce churn. For a fintech firm, it involves analyzing transaction patterns to detect and prevent fraud. In every case, the work of collecting and analyzing data is laser-focused on a tangible business outcome.
The Foundation of Business Intelligence
Effective data analysis is the bedrock of modern business intelligence. It enables a fundamental shift from instinct-based decisions to evidence-driven strategies. This pivot is critical for maintaining a competitive edge and responding with agility to market shifts.
A well-architected data strategy consistently delivers powerful outcomes:
- Deeper Customer Understanding: Gain precise insights into user behavior, needs, and pain points to build indispensable products.
- Optimized Operations: Identify and resolve bottlenecks in any process, from your DevOps pipeline to your customer support queue.
- Increased Revenue: Pinpoint upsell opportunities, refine pricing models, and improve customer retention through personalization.
- Proactive Risk Management: Detect anomalies and predict potential issues before they impact customers or financials.
The volume of available data is staggering—projected to reach 149 zettabytes globally in 2024—yet most of it remains untapped. This highlights the urgency of implementing robust pipelines to not just store data, but to activate it. To understand the scale of this opportunity, explore the importance and benefits of big data in our detailed guide.
The table below outlines how these strategic pillars translate into direct business impact.
Data Strategy Pillars and Business Outcomes
| Strategic Pillar | Core Activities | Direct Business Impact |
|---|---|---|
| Goal & Metric Definition | Establish clear KPIs; align data collection with business objectives. | Focused efforts, measurable ROI, and clear success criteria. |
| Data Architecture & Modeling | Design scalable event schemas, data models, and storage solutions. | Reliable data foundation, reduced technical debt, and faster queries. |
| Instrumentation & Pipelines | Implement tracking (CDPs, SDKs) and build automated ETL/ELT flows. | Consistent data collection and real-time data availability. |
| Data Quality & Governance | Establish automated testing, validation rules, and access controls. | Trustworthy insights and improved compliance (GDPR, CCPA). |
| Analytics & Activation | Create dashboards, run experiments, and integrate with AI/ML models. | Data-driven decisions, product innovation, and personalization at scale. |
This framework ensures every component of your data strategy serves a valuable business outcome.
A data strategy re-frames data from a byproduct of operations into a core strategic asset. It is the mechanism that turns raw information into a predictable engine for growth, innovation, and resilience.
Investing in a data strategy is about building a scalable foundation. It ensures that as your company grows, your ability to make intelligent, informed decisions grows with it, creating a powerful, self-sustaining cycle of improvement.
Designing a Practical Data Collection Framework
A data strategy that isn't directly tied to business outcomes is an academic exercise. Before collecting a single byte of data, you must define what you aim to achieve. This planning phase is the most critical step in the entire process of collecting and analyzing data, guaranteeing that all subsequent efforts are purposeful.
Translate high-level business goals into specific Key Performance Indicators (KPIs). Avoid vanity metrics like total sign-ups or page views, which often obscure the real story. Instead, focus on metrics that genuinely reflect business health and the value users receive.
Move from a vague goal like "improve user engagement" to a specific, measurable target: "increase the 7-day user retention rate from 20% to 25% within Q3." This level of specificity provides your data team with a clear objective.
From Business Goals to Measurable KPIs
Connecting objectives to tangible metrics is where strategy becomes execution. Consider these real-world examples:
SaaS Onboarding Funnel Example:
A common challenge for SaaS companies is high churn among new users. The business goal is to improve activation and reduce early-stage churn.
- Objective: Increase the completion rate of the core onboarding checklist.
- KPIs to Track:
- Funnel Completion Rate: The percentage of users who start and finish onboarding.
- Time to Value (TTV): The time it takes for a new user to perform a key value-driving action.
- Drop-off Points: The specific steps in the funnel where users abandon the process.
Tracking data at these points enables the product team to identify friction, run A/B tests on potential solutions, and measure the direct impact on retention.
Fintech Transaction Reliability Example:
In fintech, trust and reliability are paramount. Payment failures or platform instability lead to immediate user attrition. The business goal is to deliver a rock-solid, dependable experience.
- Objective: Minimize payment failures and maximize system uptime.
- KPIs to Track:
- Transaction Success Rate: The percentage of initiated transactions that complete successfully.
- API Error Rate: The frequency of errors from key payment endpoints.
- Average Transaction Latency: The time in milliseconds required to confirm a payment.
Monitoring these metrics allows engineering teams to proactively address issues, often before they affect the end-user.
Creating a Scalable Event Dictionary
With KPIs defined, the next step is to create an event dictionary (or tracking plan). This document serves as the single source of truth for data collection across your entire organization. It is fundamental for maintaining data integrity as your product and team scale.
An event dictionary defines every user action ("event") and its associated metadata ("properties"). It prevents data chaos—for example, one team tracking user_signed_up while another tracks signup_complete for the same action.
Your event dictionary is the contract between your product, engineering, and analytics teams. It ensures everyone speaks the same language and that the data collected is clean, consistent, and trustworthy from day one.
A robust event dictionary includes:
- Event Name: A clear, consistent name for the action (e.g.,
payment_submitted). - Trigger: The specific user interaction that fires the event (e.g., user clicks the "Confirm Payment" button).
- Properties: The contextual data captured with the event (e.g.,
payment_method,amount,currency). - Location: Where the event is tracked (e.g., web app, iOS, Android).
This forward-thinking framework ensures your data collection remains aligned with business value and can adapt to new features without requiring a complete overhaul. For businesses tracking sustainability metrics, a similar structured approach is essential—for instance, understanding regulations is vital for compliant ESG Data Collection with CSRD and AI.
Building Your Modern Data Pipeline
With your data framework and KPIs defined, it's time to engineer the data pipeline. This technical infrastructure is the engine responsible for collecting and analyzing data, ingesting it from disparate sources and consolidating it in a central repository for analysis.
A modern data pipeline is not a single tool but an ecosystem of integrated technologies. The objective is to create a seamless, automated flow from data creation (instrumentation) to its destination in a data warehouse. Without a solid pipeline, even the most brilliant strategy will fail due to inconsistent, unreliable, or inaccessible data.
This flowchart illustrates the foundational process: define goals, determine what to measure, and standardize the collection format.
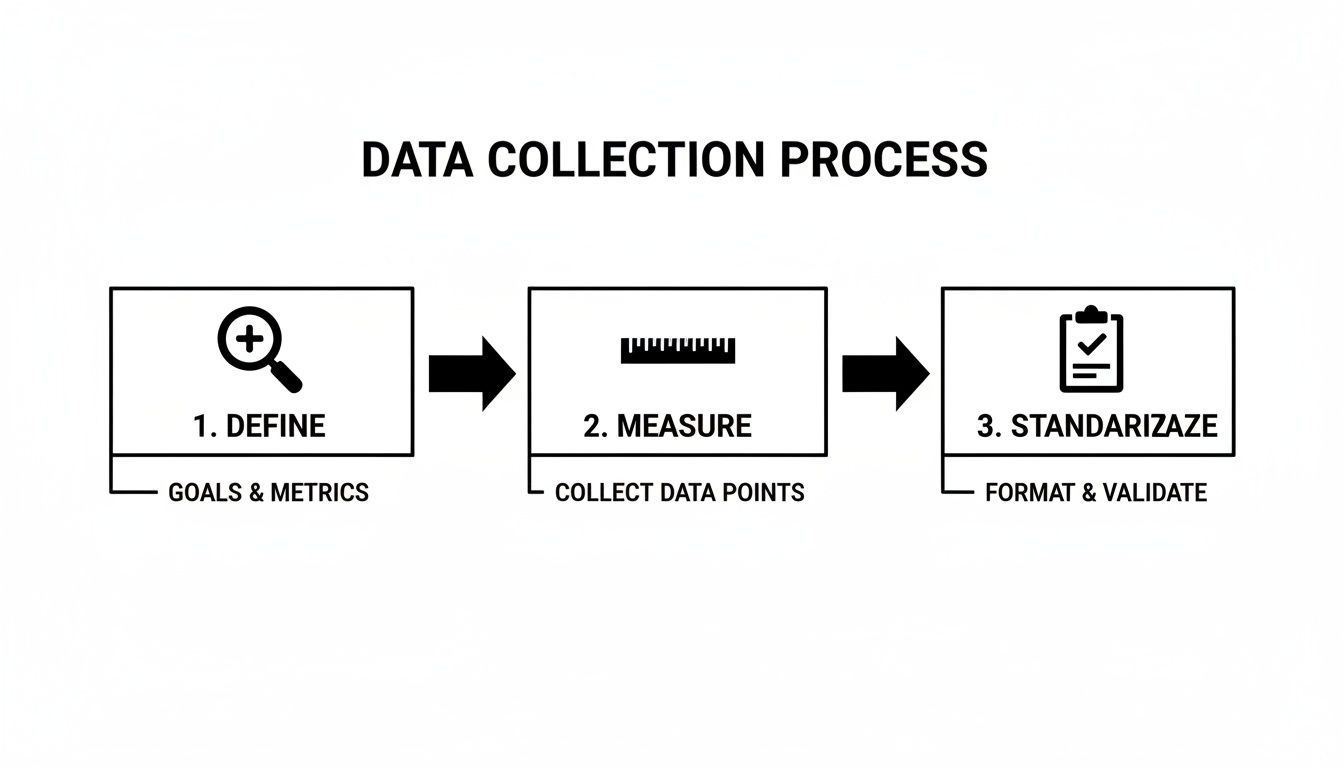
This sequence is fundamental. The data you measure must directly support the goals defined at the outset.
Choosing Your Data Collection Method
The first technical decision is how to track events. Instrumentation typically occurs on either the client-side or the server-side.
- Client-Side Tracking: This method uses JavaScript snippets or mobile SDKs within your website or app. Tools like Google Analytics or Segment are excellent for capturing rich user interactions like clicks, scrolls, and mouse movements.
- Server-Side Tracking: In this approach, events are logged directly from your backend servers. It is more reliable and secure, as it cannot be blocked by ad blockers or browser privacy settings. This is the preferred method for critical events like payment completions or sign-ups, where 100% accuracy is required.
Most businesses adopt a hybrid approach, using client-side tracking for behavioral analytics and server-side tracking for core business and transactional events.
Understanding ETL vs. ELT Processes
Once data is collected, it must be moved into your data warehouse. This is accomplished via two primary processes: ETL (Extract, Transform, Load) and ELT (Extract, Load, Transform). The key difference is where data transformation—cleaning, structuring, and enrichment—occurs.
ETL is the traditional method. Data is transformed before being loaded into the data warehouse, a necessity when databases had limited processing power.
ELT is the modern standard. Raw data is loaded directly into a powerful cloud data warehouse and transformed after it has landed, leveraging the warehouse's immense compute capabilities.
The ELT approach is a paradigm shift. It provides analysts and data scientists with access to raw, untouched data, allowing them to build new models and answer novel questions without requiring engineering intervention to modify the pipeline.
The value of collecting and analyzing data is well-established, with 97.2% of companies now investing in big data and analytics. The shift to cloud-native ELT pipelines is a major driver of this trend, with 49% of the world's data now stored in the cloud. You can see how big data is shaping business strategy in the full research.
This comparison will help you decide which architecture best fits your needs.
Comparing Data Pipeline Architectures: ETL vs. ELT
| Factor | ETL (Extract, Transform, Load) | ELT (Extract, Load, Transform) |
|---|---|---|
| Transformation Location | On a separate processing server, before loading. | Inside the data warehouse, after loading. |
| Data Availability | Only transformed, structured data is available. | Raw, unstructured data is available for flexible use. |
| Flexibility | Less flexible. New analyses often require pipeline re-engineering. | Highly flexible. Analysts can run new transformations on raw data at any time. |
| Speed | Slower, as transformation is a pre-loading bottleneck. | Faster loading times since raw data is moved directly. |
| Cost | Higher maintenance and infrastructure costs for the transformation server. | Leverages the pay-as-you-go model of cloud warehouses, often more cost-effective. |
| Best For | Legacy systems; compliance needs requiring data masking before storage. | Modern cloud data stacks, agile analytics, and machine learning use cases. |
For most modern applications, the flexibility and scalability of the ELT model make it the superior choice.
The Modern Data Stack: Build vs. Buy
Assembling your pipeline involves selecting tools for each stage. The modern data stack typically includes these layers:
- Data Ingestion and Integration: The "E" and "L" in ELT. Tools like Fivetran and Stitch automate the process of pulling data from hundreds of sources (e.g., Salesforce, Google Ads, production databases) and loading it into your warehouse with minimal engineering effort.
- Data Warehousing: Your central source of truth. Cloud platforms like Snowflake, Google BigQuery, and Amazon Redshift provide the power to store and query massive datasets efficiently.
- Data Transformation: The "T" in ELT. A tool like dbt (data build tool) allows your team to transform raw data into clean, analysis-ready datasets using SQL, while handling testing, documentation, and dependencies.
For an e-commerce company, this means using Fivetran to pull Shopify sales and Google Ads data into Snowflake. An analytics engineer then uses dbt to join these sources, creating a unified view of customer acquisition cost and lifetime value. This "buy" approach, leveraging best-in-class tools, is almost always faster and more scalable than building a custom pipeline. It allows your team to focus on generating insights, not maintaining infrastructure. To dive deeper, read our guide on designing a modern business intelligence architecture.
Turning Raw Data Into Actionable Insights

With your data pipeline operational and clean data flowing into your warehouse, the focus shifts from infrastructure to intelligence. This is the stage where the process of collecting and analyzing data delivers its true value.
Raw data is noise. The goal is to identify the signals within that noise—the clear, actionable insights that enable smarter business decisions. This is accomplished through different types of analytics, each answering a progressively more valuable question.
The Four Types of Data Analytics
Understanding these four analytical methods allows you to frame the right questions and select the appropriate tools. They represent a maturity model for data analysis, with each level unlocking deeper insights.
-
Descriptive Analytics: What Happened?
This is the foundational form of analysis, summarizing past data to provide a clear picture of historical events. Standard business dashboards displaying metrics like monthly recurring revenue (MRR), daily active users, or website traffic fall into this category. -
Diagnostic Analytics: Why Did It Happen?
When descriptive analytics reveal an anomaly—a sudden spike or dip—diagnostic analytics uncovers the root cause. This involves drilling down into the data, identifying patterns, and correlating events to understand causation. -
Predictive Analytics: What Will Happen Next?
This is where analysis becomes strategic. By applying statistical models and machine learning to historical data, you can forecast future outcomes. This enables you to anticipate customer behavior, market trends, and operational needs. -
Prescriptive Analytics: What Should We Do About It?
The most advanced level, prescriptive analytics recommends specific actions to achieve an optimal outcome. It uses simulations to model the potential impact of different decisions, guiding your team toward the most effective strategy.
Moving from descriptive to prescriptive analytics is the journey from hindsight to foresight. It’s the difference between reacting to the market and actively shaping it based on data-driven recommendations.
Putting Analytics Into Practice
Consider a SaaS platform that experiences a sudden drop in monthly active users.
- Descriptive: A BI dashboard flags a 15% drop in engagement last quarter. This is the what.
- Diagnostic: Analysis reveals the drop correlates with a new feature release. Users who engage with this feature are churning at twice the normal rate. This is the why.
- Predictive: A churn model forecasts an additional 20% loss of this user segment next quarter if no action is taken. This is the what next.
- Prescriptive: An A/B testing model recommends rolling back the feature for high-risk users and offering a targeted tutorial on the previous workflow. The model predicts this action will reduce the expected churn by 75%. This is the what to do.
Integrating Business Intelligence and Machine Learning
Sophisticated analysis requires a modern toolkit. Business Intelligence (BI) platforms like Tableau, Looker, or Power BI are essential. They connect directly to your data warehouse, enabling non-technical users to build interactive dashboards, generate reports, and explore data visually, fostering a data-driven culture. For a closer look, review our guide on creating an effective business intelligence report.
For advanced predictive and prescriptive analytics, you will integrate machine learning (ML) models. Trained on your historical data, these models can automate complex tasks that are impossible to perform manually.
Common ML Applications:
- Personalization Engines: An e-commerce site uses ML to recommend products based on browsing history and the behavior of similar users, directly increasing conversion rates.
- Fraud Detection: A fintech company analyzes transaction data in real-time to flag anomalous activity that deviates from a user's normal patterns, preventing fraud.
- Customer Churn Prediction: A subscription business identifies at-risk customers by analyzing product usage and support interactions, enabling proactive retention efforts.
By integrating powerful BI tools with ML models on a solid data foundation, you create a feedback loop where business questions are answered with data, leading to smarter, faster, and measurable decisions.
Scaling Your Data Infrastructure with Governance
Establishing a data pipeline is just the beginning. Maintaining its efficiency, security, and cost-effectiveness as your company scales is a more complex challenge. As data volume and complexity grow, a robust data governance framework becomes essential for any organization serious about collecting and analyzing data long-term.
Without governance, your data ecosystem can devolve into a chaotic, expensive, and insecure liability. This exposes your business to compliance penalties, data breaches, and unreliable insights that erode trust in your data. Effective governance is not about bureaucracy; it's about building a scalable and resilient foundation.
Navigating Data Privacy and Compliance
In a global digital economy, adherence to data privacy regulations is non-negotiable. Laws like Europe's General Data Protection Regulation (GDPR) and the California Consumer Privacy Act (CCPA) have fundamentally reshaped how personal data is managed, granting users significant rights and imposing severe penalties for non-compliance.
For any business, particularly in SaaS or fintech, privacy must be architected into your data systems from the start.
- Data Minimization: Collect only the data absolutely necessary for a specific, defined business purpose.
- Purpose Limitation: Use collected data only for the purposes disclosed to users.
- User Consent and Rights: Implement clear mechanisms for users to provide consent, access their data, and request its deletion.
This is more than a legal obligation. A demonstrable commitment to user privacy builds trust, which is a significant competitive differentiator.
Implementing Robust Security and Access Control
A centralized data warehouse is a high-value target for security threats. Protecting it requires a multi-layered security strategy, starting with Role-Based Access Control (RBAC). The principle is simple: users should only have access to the specific data required to perform their jobs.
An analyst may need read-only access to customer behavior data, while a finance team member requires access to billing information. An engineer may not need access to either. RBAC enforces this "principle of least privilege," drastically reducing security risk.
Additional critical security practices include:
- Data Encryption: Encrypt data both in transit (as it moves through your pipeline) and at rest (while stored in your warehouse).
- Regular Audits: Routinely review access permissions and revoke those that are no longer necessary.
- Anonymization: Mask or remove personally identifiable information (PII) from datasets used for general analysis.
Maintaining Data Quality and Performance at Scale
As data volume grows, two operational challenges emerge: maintaining data quality and controlling costs. Low-quality data leads to flawed decisions, while uncontrolled cloud expenses can cripple a growing business.
To ensure data integrity, implement automated data quality testing. Tools like dbt allow you to write tests that check for freshness, uniqueness, and valid values every time your pipeline runs. If a test fails, your team is alerted immediately, preventing bad data from contaminating your BI dashboards.
Simultaneously, monitor the performance and cost of your data stack. Cloud data warehouses operate on a pay-as-you-go model, where inefficient queries can lead to unexpectedly high monthly bills.
- Monitor Query Performance: Identify and optimize slow or expensive queries that consume excessive compute resources.
- Set Budgets and Alerts: Use your cloud provider's tools to establish spending limits and receive notifications before costs escalate.
- Optimize Storage: Implement data lifecycle policies to automatically archive or delete old data that is no longer required for active analysis.
By combining strong governance, robust security, and proactive monitoring, you can build a data infrastructure that is not only powerful but also sustainable and cost-effective at scale. This is a core pillar of any well-designed system, a topic we explore in our guide on business intelligence architecture.
Summary and Next Steps
Successfully collecting and analyzing data is a strategic imperative that transforms business operations from reactive to predictive. It requires a holistic approach that begins with clear business objectives and culminates in a scalable, secure, and governed data ecosystem.
By focusing on measurable KPIs, designing a robust data pipeline with the modern data stack, and advancing through the four types of analytics, your organization can unlock the insights needed to drive growth, optimize efficiency, and build a sustainable competitive advantage. The journey from raw data to actionable intelligence is a continuous cycle of refinement, but the ROI is undeniable.
Your Action Plan:
- Define Your Core KPIs: Start by identifying the top 3-5 metrics that are most critical to your business success right now.
- Audit Your Current Data Sources: Map out where your most valuable data currently lives and identify any collection gaps.
- Design a Minimal Viable Tracking Plan: Create a simple event dictionary for one key user journey, such as onboarding or checkout.
- Evaluate Your Tooling: Assess whether your current tools support a modern ELT architecture or if you need to explore new solutions for ingestion, warehousing, or transformation.
- Build Your First Dashboard: Connect a BI tool to your data and create a simple dashboard to track the KPIs you defined in step one.
At Group107, our expertise lies in building the robust data pipelines, scalable architecture, and AI-driven solutions that turn raw data into your most valuable business asset. We provide dedicated offshore teams of data specialists and engineers who integrate seamlessly with your organization to deliver real, measurable results.
Ready to build a data strategy that drives growth? Connect with us today.