A business intelligence report is not just a collection of charts and numbers; it’s a strategic tool that transforms raw data into a clear narrative. It empowers leadership teams to track performance, identify emerging trends, and make critical decisions with confidence. Unlike a simple dashboard that shows real-time metrics, a BI report delivers a comprehensive analysis of a specific business question, providing the context needed to drive meaningful action.
From Data Points to Strategic Direction
In today’s data-driven economy, a business intelligence report is no longer a luxury—it’s a core asset for maintaining a competitive edge. Think of it as a detailed roadmap for your organization. While a dashboard offers a live snapshot, like the gauges in a car, a BI report is the full diagnostic check. It explains why the metrics are changing and recommends the best course of action.
This capability is crucial for leaders in demanding sectors like SaaS, finance, and e-commerce, where relying on guesswork is not an option. A well-constructed business intelligence report can uncover hidden patterns in customer behavior, pinpoint costly operational bottlenecks, or flag a market trend before competitors react.
The Shift to Dynamic Analysis
BI reports have evolved from static, historical documents into interactive, dynamic tools. Modern reports empower users to drill down into the data, apply filters, and ask ad-hoc questions directly within the interface. This shift from passively consuming information to actively exploring data is a game-changer for business agility.
The process is cyclical: data is gathered from disparate business systems, processed, analyzed, and transformed into actionable knowledge.
This flow illustrates how scattered, raw data is refined into meaningful information, which ultimately fuels smarter business strategies and operational improvements.
The market’s rapid expansion underscores the growing importance of BI. The global business intelligence market reached USD 31.34 billion in 2024 and is projected to more than double to USD 63.17 billion by 2034. This explosive growth, detailed in these BI market insights, shows that BI is no longer a niche IT function. It’s a fundamental business capability, and mastering BI reporting means turning your data into your most powerful strategic asset.
The Building Blocks of a Powerful BI Report
A high-impact business intelligence report is more than a compilation of charts; it’s an analytical tool engineered for one purpose: to improve decision-making. Each component has a specific function, and when integrated effectively, they transform mountains of complex data into a clear, actionable story.
The entire process—from raw numbers to strategic insight—is about creating clarity. The report acts as the central hub where stakeholders can track performance against goals, identify developing trends, and uncover hidden opportunities.
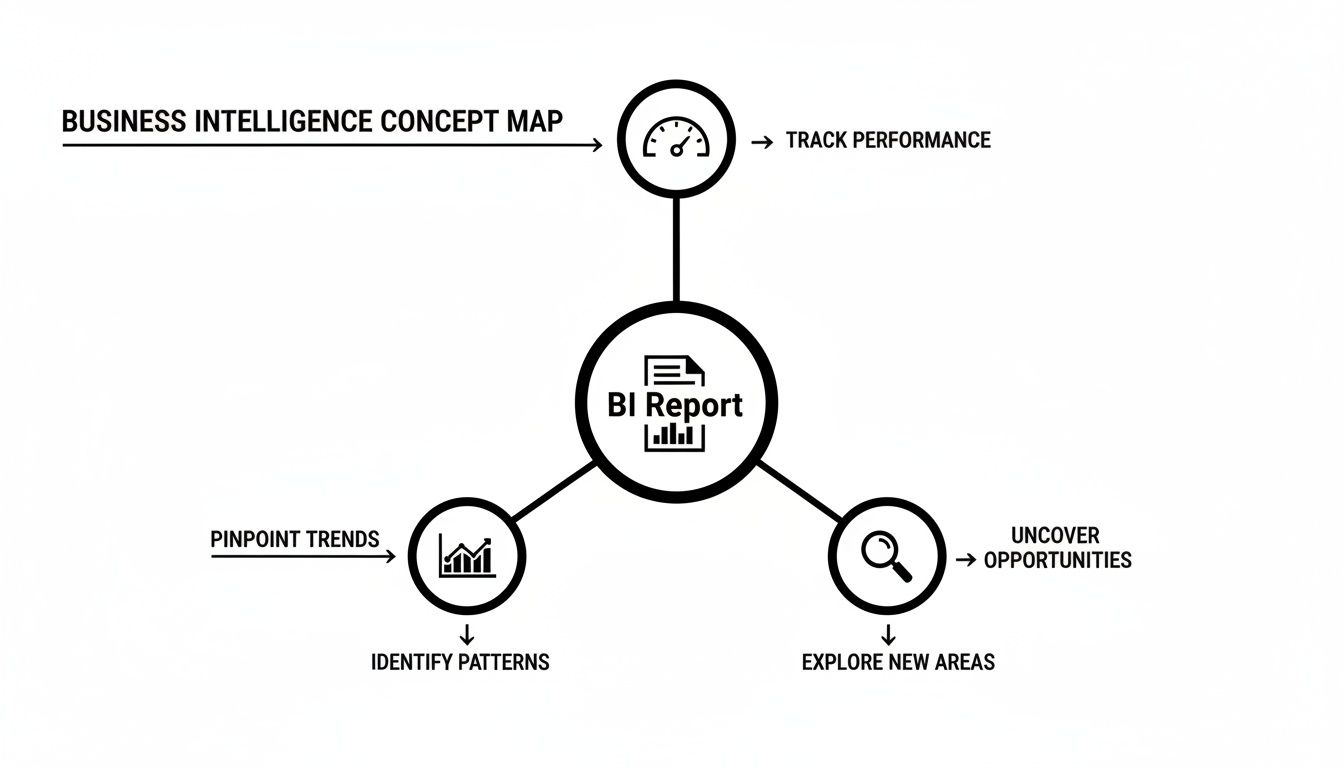
As this illustrates, the end goal is always to fuel business growth. To achieve this, every effective report relies on a few essential components working in unison. Let’s break down what those are.
Essential Components of a Business Intelligence Report
To build a report that delivers tangible value, you must combine several key elements. Each one plays a distinct role in transforming data from the high-level “what” to the granular “why.”
| Component | Purpose | Best Practice Example |
|---|---|---|
| Key Performance Indicators (KPIs) | Measure progress against strategic business goals. These are the vital signs of your operations. | Tracking “Customer Lifetime Value (CLV)” instead of just “Website Visitors.” |
| Data Visualizations | Make complex data easily understandable at a glance by revealing patterns, trends, and outliers. | A line chart to show sales performance trends over the last 12 months. |
| Narrative & Analysis | Explain the “so what?” behind the data, providing context, interpretation, and actionable recommendations. | Adding a summary: “Q3 revenue dipped 5% due to a seasonal slowdown and increased competitor ad spend in the APAC region.” |
| Interactive Elements | Allow users to explore the data themselves by filtering, sorting, or drilling down into details. | Adding a dropdown filter so executives can view performance by product line, region, or sales team. |
| Data Sources | Provide the raw information from which all insights are derived, ensuring a single source of truth. | Combining sales data from your CRM with marketing campaign data from Google Analytics and ad platforms. |
By integrating these components, a business intelligence report evolves from a static data dump into a dynamic tool for strategic management and operational excellence.
Key Performance Indicators (KPIs)
KPIs are the pulse of your business strategy. An effective BI report doesn’t drown stakeholders in data; it focuses on the few critical metrics that directly measure progress toward core business objectives. Avoid vanity metrics that look impressive but offer no actionable insight.
- Align with Strategy: Every KPI should answer a specific business question. “What is our customer churn rate this quarter?” is a strategic KPI. “How many social media followers did we gain?” often is not.
- Make them Actionable: A strong KPI should point toward a clear next step. If your Customer Acquisition Cost (CAC) is rising, it’s a direct signal to analyze marketing channel efficiency.
- Provide Context: Numbers lack meaning in isolation. A 15% increase in website traffic is only truly insightful when compared to the previous period, the quarterly target, or industry benchmarks.
Data Visualization and Narrative
How you present your data is as critical as the data itself. Data visualization is the art of selecting the right format to make complex information instantly digestible and reveal the story hidden within.
A well-chosen chart doesn’t just display data; it communicates insight. A line chart is perfect for tracking trends over time, while a bar chart excels at comparing distinct categories.
However, visuals alone are rarely sufficient. The real value emerges when you add a narrative—the human analysis that explains why the numbers are what they are. This context answers the crucial “so what?” question, turning a simple chart into a strategic recommendation. Making sense of these patterns is essential, especially when dealing with the massive datasets we cover in our guide to what big data is and why it’s important.
Finally, incorporating interactive elements like filters and drill-downs is a game-changer. This empowers your team to move from passively reading a report to actively exploring the data. When stakeholders can slice the numbers by region, product, or time period, they start uncovering their own powerful insights.
Designing Your Report for Clarity and Impact
A brilliant business intelligence report can fail for one simple reason: it’s confusing. Great design isn’t about flashy graphics; it’s about clarity and usability. It’s what separates a report that drives decisions from one that gets archived and ignored. The right design ensures your insights land with maximum impact, guiding your audience directly to what matters most.

The entire process must be audience-centric. A CEO doesn’t need to see granular marketing campaign data, but a marketing manager absolutely requires it to optimize spend. Before building a single chart, you must define who the report is for and what single business question they need answered.
Start with the Central Question
Every powerful BI report is built around a core business question. Attempting to show everything at once results in a cluttered, unfocused report that answers nothing. Instead, anchor your entire report to one specific, high-value problem.
This focus simplifies every subsequent decision, from choosing the right KPIs to selecting the best visualization methods.
- For a SaaS company: “Which user onboarding steps have the highest drop-off rate, and what is the impact on trial-to-paid conversion?”
- For a finance team: “What are the primary drivers behind our Q3 variance in operational expenses compared to forecast?”
- For an e-commerce brand: “How did our recent promotional campaign affect customer lifetime value (CLV) across different acquisition channels?”
When you frame your report this way, every element serves a clear purpose. It logically moves the reader from the problem to the solution, transforming an analytical document into a valuable decision-making asset.
Principles of User-Centric Report Design
Once you have your central question, the goal is to present the answer as clearly and intuitively as possible. This means stripping away anything that doesn’t add value—a concept known as eliminating “chart junk.” The best reports use visual hierarchy to guide the reader’s eye to the most critical information first. For actionable tips on visual presentation and effective data storytelling, you can explore various approaches to dashboard design best practices.
Good design is about subtraction, not addition. The goal isn’t to show how much data you have; it’s to show how little the user needs to see to understand the key message.
To put this into practice, follow this simple framework for structuring your report:
- Lead with the Answer: Start with a high-level executive summary or dashboard that directly answers the main business question. This gives time-constrained leaders the key takeaway immediately.
- Provide Supporting Evidence: Use clear, well-labeled charts and tables to back up your initial summary. Each visualization should tell one part of the story, such as comparing performance over time or highlighting a trend.
- Offer Granular Detail: Finally, include drill-down capabilities or appendices that allow curious users to explore the raw data if they need to. This layered approach satisfies all audiences, from high-level strategists to on-the-ground analysts.
By designing with intent, you transform your business intelligence report from a passive document into an active, indispensable tool for decision-making.
Choosing the Right BI Tools for Your Business
Selecting the right software for your business intelligence strategy is a critical decision. The right tool accelerates your efforts, while the wrong one creates a significant roadblock for your team. The market is saturated with options, but a smart choice boils down to practical factors that align with your current needs and future ambitions.
Your BI platform should integrate seamlessly into your tech stack, not feel like a clunky add-on. Key evaluation criteria include ease of use for non-technical teams, smooth integration with existing systems like Azure or Salesforce, and its ability to scale with your business. This is a strategic investment in your company’s data infrastructure, not just a feature comparison exercise. The right tool is a cornerstone of your overall business intelligence architecture, ensuring data flows efficiently from source to report.
Evaluating the Market Leaders
When discussing tools for creating a business intelligence report, two names consistently dominate the conversation: Microsoft Power BI and Tableau. It’s impossible to ignore Microsoft Power BI, which holds over 30% of the market share, largely due to its seamless integration within the broader Microsoft ecosystem. The U.S. BI software industry is a USD 33.6 billion market, and Microsoft’s position is clear.
So, how do you evaluate your options?
- Microsoft Power BI: If your organization already leverages Microsoft products like Office 365 and Azure, Power BI is an excellent choice. It offers robust capabilities at a competitive price point and is known for its user-friendly interface, enabling faster adoption by non-technical staff.
- Tableau (a Salesforce company): Tableau is a leader in data visualization. It excels at creating stunning, highly interactive reports that transform dense datasets into easily understandable and explorable insights. It also offers broad connectivity to a vast array of data sources, including Salesforce.
Cloud-Based BI and Specialized Solutions
Today, cloud-based BI platforms are the standard for good reason. They provide the agility, scalability, and cost-efficiency that legacy on-premise solutions cannot match. Furthermore, they enable teams to access critical reports from anywhere, fostering a more collaborative and data-driven culture.
Your evaluation should focus on these key questions:
- Total Cost of Ownership (TCO): Look beyond the license fee. What are the true costs of implementation, training, and ongoing maintenance?
- Technical Resources: Be realistic about your team’s skills. Will you need to hire specialists, or can your current analysts master the new tool with minimal training?
- Strategic Alignment: Does the platform’s core strength match your primary objective? Are you focused on operational reporting, advanced analytics, or customer-facing dashboards?
Remember, general-purpose tools are not always the best fit. Businesses with complex financial operations might find that specialized treasury management systems are more effective, as they offer reporting and analytics features built specifically for finance. Ultimately, choosing the right tool is about finding the optimal balance of power, usability, and cost for your unique business context.
Putting Your BI Reports into Action Across the Company
A brilliant business intelligence report generates zero ROI if it sits unread in an inbox. True value is unlocked only when it is actively used to drive decisions and optimize processes. Implementing a successful BI reporting strategy requires more than just sending an email; it demands a strategic initiative to embed data into your organization’s daily operations.

This requires a thoughtful approach that aligns your technology, people, and processes. Without a clear implementation plan, even the most insightful report can fail to make a real business impact.
Establishing a Foundation of Trust
Before anyone acts on a report, they must trust the data. This is where data governance becomes non-negotiable. Data governance is the framework of rules and processes that ensures your data is accurate, consistent, and secure across the entire organization.
Strong governance breaks down data silos and establishes a single source of truth. When sales and marketing both pull from the same verified dataset, you eliminate unproductive “my numbers versus your numbers” debates. Instead, everyone can focus on interpreting what the data reveals.
The ultimate goal is to foster a culture where data is the common language for debate and decision-making. Trust in the data is the foundation of that culture.
This cultural shift is accelerating as businesses adopt more flexible systems. The global cloud BI market is projected to reach USD 15.2 billion by 2026, driven by companies that require scalable data solutions. This trend is amplified by the fact that over 33% of large businesses now combine BI with AI, a practice you can explore further in these business intelligence statistics.
A Phased Rollout for Lasting Success
Attempting to deploy a BI strategy across the entire company at once is a recipe for failure. A more effective approach is to phase it in, building momentum and demonstrating value one step at a time.
This method minimizes risk and allows you to refine your process as you learn.
- Start with a Pilot Project: Identify a single department or team with a clear, high-impact problem that a BI report can solve. Choose a group that is open to change and eager to participate.
- Create Internal Champions: The goal of the pilot is to create a success story. When that first team achieves a measurable win—such as identifying a significant cost-saving opportunity—they become your most powerful advocates for broader adoption.
- Provide Comprehensive Training: Don’t just provide a report; teach people how to use it. Training should focus on building data literacy, showing teams how to interpret charts, ask insightful questions, and apply findings to their daily work.
- Scale and Iterate: With a successful pilot and enthusiastic champions, you can begin expanding to other departments. Apply the lessons learned from the first round to make the next phase of training and implementation even smoother.
This methodical approach helps overcome resistance by demonstrating tangible benefits first, ensuring your investment in business intelligence delivers a strong return.
Turn Your Data into a Competitive Advantage
We’ve laid out the blueprint for building and deploying a powerful business intelligence report. Now, it’s your turn to put it into action. A successful BI initiative comes down to a few core principles: always design for your audience, choose the right tools, and ensure company-wide adoption. But turning that plan into reality requires a robust technical foundation.
At Group 107, we specialize in building that foundation. A BI report is only as good as the data and infrastructure that power it. With our deep expertise in DevOps and AI automation, we ensure your data pipelines are resilient, scalable, and capable of delivering real-time insights.
From Blueprint to Business Impact
Building a true BI practice isn’t just about buying software; it’s about embedding data into the fabric of your organization. This means creating systems that can manage complex data streams and automate the heavy lifting of transforming raw numbers into clear, actionable intelligence. For example, knowing how to use AI in business effectively can supercharge your analytics, uncovering predictive insights that traditional reports often miss.
A business intelligence report is the final, visible layer of a much larger, more complex process. Its value is entirely dependent on the strength of the underlying architecture—from data collection and processing to automated delivery.
We help businesses connect those dots. By optimizing your cloud infrastructure and implementing smart automation, we ensure your BI reports are not just accurate—they’re delivered with the speed your teams need to stay ahead of the competition.
Ready to stop treating data as a passive asset and start using it as your most powerful competitive advantage? The first step is understanding your current capabilities. Schedule a data maturity assessment with our team to pinpoint your biggest opportunities for growth, or explore our case studies to see how we’ve helped other companies make data-driven decisions that deliver measurable business results.
Summary and Next Steps
Building a valuable business intelligence report is a strategic process, not just a technical task. To succeed, you must:
- Define the Purpose: Start with a clear business question your report needs to answer.
- Focus on Key Metrics: Select KPIs that are directly tied to strategic goals and are actionable.
- Design for Clarity: Use clean visualizations and a logical structure to make insights easy to understand.
- Choose the Right Tools: Select BI software that aligns with your team’s skills, existing tech stack, and budget.
- Drive Adoption: Foster a data-driven culture through a phased rollout, training, and building trust in your data.
Your actionable next step is to identify one critical, unanswered question in your department. Use the framework above to outline a simple BI report to address it. Start small, iterate based on feedback, and demonstrate value quickly. This initial success will be the foundation for scaling your BI efforts across the organization.
Ready to turn your raw data into a real strategic asset? Group 107 has the expert data engineering, AI integration, and DevOps services you need to build a powerful, scalable BI foundation. Explore our end-to-end digital solutions and start making decisions with confidence.